This book stems from a series of biennial conferences devoted to issues affecting air-transport provision in remoter regions that have been organized by the Centre for Air Transport in Remoter Regions at Cranfield University. The primary aim of the conferences has been to provide an opportunity for those responsible for operating, managing, regulating and financing air transport services and associated infrastructure in these areas to be informed of the latest best-practice initiatives, to contrast different policy approaches and to debate potential solutions to perennial problems. Remoter regions has been a neglected area of air transport, as much of the focus of public and media attention is on the larger airlines, airports and aircraft. While the number of large airports in the world is in the hundreds, there are many thousands of smaller airports providing communities all over the globe with vital air links. More often than not these services and the airports to which they are operated are loss making and require subsidies to sustain them. There are therefore many more interested parties involved in both providing and deciding issues relating to the provision of air transport in these situations, most especially central, regional and local governments who are charged with financing these activities. The book contains 17 chapters from experts in remote-region air transport, within the following 5 sections: - Key economic and socio-economic issues - Subvention mechanisms - Route development initiatives - Infrastructure provision - Issues affecting the provision of air services in remoter regions.
Trusted by 375,005 students
Access to over 1.5 million titles for a fair monthly price.
Chapter 1 Deciding Upon the Right Amount of Air Transport Services in Remoter Regions – Key Issues
Svein Bråthen
Introduction
Air transport services are a key factor in the transport system in rural areas. They allow human and natural resources to be used efficiently in a modern society. Air transport is very important for long-distance travel and for connecting remote areas to the rest of the world. In order to provide air transport, the air transport industry utilises primary resources, such as labour and capital, as well as intermediate products. Air transport itself is a product which is delivered partly as an intermediate product for other industries and partly for final demand like leisure travel.
The air transport industry, as well as other production activities, has impacts for resource allocation as well as for value added and income. Air transport services also act as a catalyst in industrial development, particularly in connection with the exploitation of location-specific natural and human resources. These catalytic impacts could be very important both from an economic efficiency and regional balance perspective. They are further discussed in Chapter 4.
To be able to provide efficient air transport services, it is important to have an adequate balance between level of service, air fares and subsidies. Excessively high prices may cause undesirable traffic deterrence and hence the benefits of the resources that are put into the air transport services are not fully utilised. On the other hand, if fares are set too low and/or the level of service is too high, then this may give excess demand and/or too many resources may be put into the air transport system.
In this section, we will discuss some key issues with respect to how the level of service in air transport can be determined, and what the economic consequences of a well-functioning air transport service are. The link between costs, prices and economic efficiency will be an important part in this discussion. Theoretically, the trade-off between fares, subsidies and departure frequency should be balanced so that the marginal willingness to pay for the air services should be equal to the costs of the marginal waiting time for the passengers. Firstly, market imperfections, costs issues and the balance between fares, costs, level of service and subsidies will be discussed. Secondly, tendering as a means of efficient provision of airport services will be briefly presented. Finally, air transport services and the impact on economic efficiency in remoter areas will be commented on.
Market Imperfections and Economic Efficiency
Air transport causes a lot of effects which may call for some kind of attention by the public authorities. One of the analytical approaches that is appropriate when dealing with various problems in air transport economics is applied microeconomics.
In general, the authorities are involved in airline markets because they may fail to achieve economic efficiency, mainly with respect to these three categories:
• inability to provide public goods in line with the society’s preferences;
• the presence of externalities;
• imperfect competition.
Air transport services can be seen as a kind of public good as long as there is excess capacity, and society may have preferences for offering them in remoter areas for equity reasons. External effects are elements of costs and benefits that are not or only partly priced in the market. Examples may be costs of CO2 emissions and benefits from improved communication in, for example, industrial networks. In most cases, imperfect competition may cause air fares to rise well beyond marginal costs. Imperfect competition based on natural monopolies (increasing returns to scale) may also call for subsidies to maintain economic efficiency.
In this section, we are going to focus mostly on the third of these elements. Indirectly, this element is also a discussion of the right amount of services to be provided in remoter areas; hence the first element will also be discussed. The main source of inefficiency is when the price of a product or service is set differently from the marginal social costs. On low-volume routes, the difference between price and marginal cost may become high, probably too high, without some kind of money transfer, either by means of cross-subsidies or by public subsidies.
Prices and Subsidies in Air Transport
We are now going to discuss theoretically what the demand and supply side of air transport in remoter areas may look like. In Figure 1.1, price Pm with the corresponding quantity Qm is the situation for a profit-maximising monopolist, such as an airline that has a licence to operate a given Public Service Obligation (PSO) route.
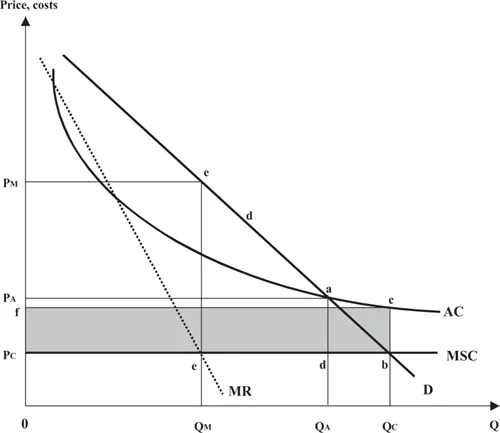
Figure 1.1 Output and pricing policies in a natural monopoly
The production takes place as long as the marginal revenues (MR) exceed the marginal costs (MSC) at point e. If the monopolist is regulated by the authorities to e.g. charge a price equal to the average cost (AC), then the price will be PA and the output will be QA. However, the social optimum is where the price equals the marginal cost (MSC), with the corresponding output QC. The fixed costs are however not covered, and the financial loss will be the shaded area Pcfcb. This loss has to be covered by subsidies. A first-best pricing regime (price equals the marginal cost) gives a financial loss in a situation with a natural monopoly (increasing returns to scale). A regulatory regime where the monopolist is allowed to charge the price PA, incurs a socioeconomic loss equal to the area abd. It is worth noting that in many cases, the capacity is well in excess of demand, meaning that the intersection between the D curve and the AC curve in Figure 1.1 takes place where the AC curve is well above the MSC curve. In those cases, a pure AC pricing policy will incur a higher PA, a significantly larger adb triangle and hence the economic welfare loss to society will also be larger. The slope of the demand curve is also of interest. A steeper, less price-elastic curve will cause a smaller welfare loss.
Price Elasticity Is An Important Measure
The price elasticity gives percentage change in demand following percentage change in prices, and is used for assessing, e.g., revenue effects of air fare adjustments. As seen below, the price elasticity is an important measure when assessing efficient prices and level of service in air transport in remoter areas.
There are not many studies of price elasticity for air transportation. The most recent one is Njegovan (2006), who cites a number of other studies. One of them is Dargay and Hanly (2001) who used a time series from 1989 to 1998 to estimate a price elasticity of -0.6 for outbound international tourism from the UK. An interesting feature of this study was that other factors like currency parity and relative prices affected the demand for air services even more. Njegovan (2006) found the price elasticity in the same market to be -0.7, based on a time series from 1993 to 2003.
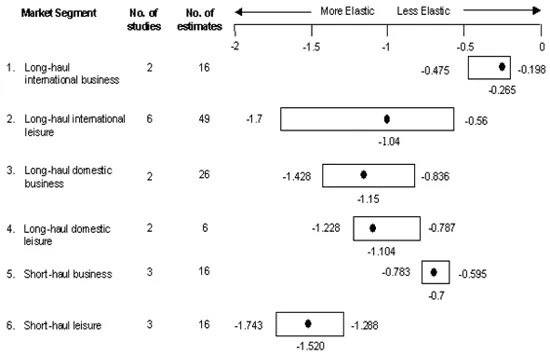
One of the most cited studies is Gillen et al. (2003), who examined 21 studies of price elasticity in various air transport segments in different countries. These studies were mainly based on time series analyses. This study is also the main source of information to support European Commission (2005), where the consequences of fuel taxes in the European Economic Area are discussed. Figure 1.2 summarises the findings from Gillen et al. (2003).
The variations appear to be quite large. Short-haul domestic (which is a significant part of the market for air transport services in remoter areas) has a median of -0.7, varying between -0.6 and -0.8. Domestic leisure travel is considerably more elastic, with a median of -1.5, varying between -1.3 and -1.7. A Norwegian study (Helgheim, 2002) of two domestic markets shows a price elasticity of mainly between -0.6 and -1.0, with a leisure travel segment ranging as high as -1.4. The interesting feature of this study was that it indicated an increasing elasticity with higher air fares, which is in good accordance with economic theory. Rekdal (2006) used network model simulations indicating somewhat lower price elasticity for air transport in the range of -0.41 to -0.76.
Figure 1.2 Variations in direct price elasticity for air transport services
Source: Gillen et al. (2003).
Optimal Pricing of Air Transport Services with Subsidies
In connection with regional air services, the trade-off between economic efficiency (price Pc and the economic loss PCfcb) and cost coverage (price PA with traffic loss QC-QA) will often end in a discussion of compromising between public financial outlays and making the air transport services reasonably priced to make the system serve the remoter regions in an adequate way. This discussion tends to be more important on routes where the payload is low and where a minimum level of service has to be provided (less demand causes the intersection between the average cost curve AC and demand D to be well towards the left of point a in Figure 1.1), as compared to the PSO routes where traffic is rather high (intersection between AC and D, say, between point c and a in Figure 1.1). One way to do this is to price the services optimally, however constrained by the maximum level of subsidies the public authorities are willing to pay. In practice, this means that the authorities are willing to cover some of the shaded area in Figure 1.1, but not all of it. We call this pricing strategy the optimal departure from marginal cost pricing, or second-best pricing. We talk about a financial constraint, namely the maximum subsidy that the authorities are willing to accept or, conversely, the minimum revenues that have to be collected from the passengers to ensure that the ‘maximum subsidy’ criterion is met and at the same time maximise economic efficiency. We are now interested in how this can be done so as to minimise the economic welfare loss (the ‘deadweight loss’).
Consider a ‘thin’ regional air transport route where there are two market segments in a monopolised market. A reasonable assumption is that these markets have different price elasticity. The demand xi=xi(pi) is dependent on the price level. Conversely, the prices are dependent on the demand:
(1) pi = pi(xi)(i=1,2)
The cost function for both market segments is expressed as:
(2) C = c1(x1) + c2(x2) + B
C is total costs, B is fixed costs, cixi are variable costs dependent on traffic for each market segment.
The financial constraint can now be expressed in a way that the revenue minus fixed and variable costs should at least equal the revenue necessary to satisfy the maximum subsidy constraint:
(3) [p1x1 + p2x2] – [c1(x1) + c2(x2) + B] ≥ π
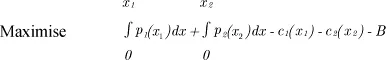
We are now going to maximise the consumer surplus (the area between the demand curves and the cost curve), given the budget constraint (or subsidy constraint)π. This can be expressed as:
given the constraint
p1x1 + p2x2 - c1(x1) - c2(x2) - B ≥ π
By using Lagrange’s method for partial derivation, we get:
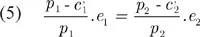
Equation (5) is useful in practical pricing policies. p1 and p2 are the air fares in each market segment, e1 and e2 are the price elasticity for each segment and
and
are the marginal costs. The economic interpretation of the equation is that if there are binding financial constraints, prices should be set higher than the marginal costs. The difference from marginal cost pricing should be higher in the market segment with the lowest price elasticity, implying that the price is set higher in the segment with the least price sensitivity. This is done to ensure a minimum welfare loss. The achievement is therefore important because the welfare loss for the consumers in each market segment is minimised.
The price elasticity in each segment has to be different in order to differentiate the prices, but the marginal cost can be equal (which is normally the case in an aircraft with two market segments). Imagine that market 1 is the market for business travel (low price elasticity) and market 2 is the market for leisure travel. The marginal costs and the demand elasticity are normally known, and the point of departure is to set the prices in one of the segments as the ‘target price’. For example, one might want to have a low fare for leisure travel. Equation (5) can then be used to calculate the price in the other market segment in order to satisfy the subsidy constraint. The subsidy constraint can be determined by considering the average variable costs per passenger that are caused by each departure. The difference between total costs and the average variable costs per departure can be considered as the optimal subsidy level, given that the correct level of service (LOS) is established, such as aircraft size and departure frequency. The correct LOS can be determined by studying the level where the waiting time costs for the passengers is equal to the costs of an incremental increase in the number of departures. By doing these considerations, optimal...
Table of contents
Cover Page
Title Page
Copyright Page
Contents
List of Figures
List of Tables
Acknowledgements
Editors and Contributors
Introduction by George Williams
PART A PROVISION OF AIR SERVICES AND THEIR IMPACT
PART B SUBVENTION MECHANISMS
PART C INFRASTRUCTURE PROVISION
PART D INNOVATION
PART E KEY FUTURE ISSUES
Index
Frequently asked questions
Yes, you can cancel anytime from the Subscription tab in your account settings on the Perlego website. Your subscription will stay active until the end of your current billing period. Learn how to cancel your subscription
No, books cannot be downloaded as external files, such as PDFs, for use outside of Perlego. However, you can download books within the Perlego app for offline reading on mobile or tablet. Learn how to download books offline
Perlego offers two plans: Essential and Complete
Essential is ideal for learners and professionals who enjoy exploring a wide range of subjects. Access the Essential Library with 800,000+ trusted titles and best-sellers across business, personal growth, and the humanities. Includes unlimited reading time and Standard Read Aloud voice.
Complete: Perfect for advanced learners and researchers needing full, unrestricted access. Unlock 1.5M+ books across hundreds of subjects, including academic and specialized titles. The Complete Plan also includes advanced features like Premium Read Aloud and Research Assistant.
Both plans are available with monthly, semester, or annual billing cycles.
We are an online textbook subscription service, where you can get access to an entire online library for less than the price of a single book per month. With over 1.5 million books across 990+ topics, we’ve got you covered! Learn about our mission
Look out for the read-aloud symbol on your next book to see if you can listen to it. The read-aloud tool reads text aloud for you, highlighting the text as it is being read. You can pause it, speed it up and slow it down. Learn more about Read Aloud
Yes! You can use the Perlego app on both iOS and Android devices to read anytime, anywhere — even offline. Perfect for commutes or when you’re on the go. Please note we cannot support devices running on iOS 13 and Android 7 or earlier. Learn more about using the app
Yes, you can access Air Transport Provision in Remoter Regions by Svein Bråthen, George Williams in PDF and/or ePUB format, as well as other popular books in Technology & Engineering & Business General. We have over 1.5 million books available in our catalogue for you to explore.