
- 188 pages
- English
- ePUB (mobile friendly)
- Available on iOS & Android
eBook - ePub
Business Leadership for IT Projects
About this book
The track record of IT projects is poor. Less than a third of IT projects deliver what they said they would, on schedule and on budget. The major cause of IT project failure is not, as you might expect, poor IT leadership or difficult technology but poor business leadership. One of the reasons for this is that, unlike their IT peers, business managers often get little training or education in project delivery, let alone the special case represented by an IT project. Business Leadership for IT Projects addresses the gap by providing tools and ideas that are applicable to all sizes of IT projects, from those in large multinational corporations, down to small growing businesses. It sets out the key project touchpoints where business leadership can have a major impact on project success. The book combines psychological research and project best practice to create a practical toolbox that can be dipped into, as needs arise, or followed as an overall approach to IT project leadership. The toolbox weaves together three key strands of thought. First, that the concept of value should be at the forefront of project design and delivery. Second, that business managers need to take active leadership of IT projects to secure value. Third, that project teams need tools to slow down their thinking and ensure that actions and decisions are well thought through.
Trusted by 375,005 students
Access to over 1.5 million titles for a fair monthly price.
Study more efficiently using our study tools.
Information
1
Don’t Do IT
IT projects are usually expensive and slow to deliver relative to other business changes and operational costs (see below). More often than not, they fail to deliver their expected value at close to anything like the estimated budget and schedule. This chapter aims to make you aware of how frequently IT projects go wrong and, before you commit to an IT project, gives you some common scenarios where the risk and cost of an IT project is not the only option.
If you are already committed to an IT project, you might think that it is too late to reconsider. But once you have read this chapter, think about how much is yet to be spent on your project. Use the one minute-health-check given in the Introduction and evaluate whether the money yet to be spent is likely to get you the value you want.
IT Projects Usually Exceed their Cost and Time Estimates
THE STANDISH GROUP SURVEY OF 70,000 PROJECTS
The most often quoted studies into overruns and their causes come from the Standish Group, whose first report was published in 1995.1 It was based on replies from 365 respondents, covering 8,380 projects, mainly in the USA, and it reported that:
• 31 per cent of projects were cancelled before they were completed (classified as ‘impaired’);
• 53 per cent cost 189 per cent of their estimates (classified as ‘challenged’);
• just 16 per cent were delivered on time and on budget (classified as ‘successful’).
The report also stated that in large companies, completed projects contained only 42 per cent of their originally proposed features. The figures were better in small companies, with 78 per cent of projects delivering 74 per cent of their originally proposed features. The report concluded that: ‘Software development projects are in chaos’. The report was named ‘the CHAOS Report’ (no-one seems to remember why the word ‘chaos’ was in upper case, but it has been retained ever since).
Since 1995, the Standish Group has run its survey annually and has developed a subscription service for its data and its advice on best practices, which are derived from that data. By 2010, the CHAOS Report had become the CHAOS Manifesto,2 with ‘15 years of data on why projects succeed and fail, representing 70,000 completed IT projects’ originating from respondents worldwide. At the time of writing, the latest available figures on ‘success and failure’ come from projects surveyed in 2008 and reported in 2010. These show that:
• 24 per cent of projects were cancelled (either prior to completion or were never used);
• 44 per cent were late, overbudget and/or with less than the required number of features and functions;
• 32 per cent delivered required features and functions on time and on budget.
As the figures are better than 1996, you might be tempted to conclude that things are slowly improving. Unfortunately, the improvement in performance from 1995 to 2008 masks the fact that 2008’s figures represent what the Standish Group calls ‘the highest failure rate in over a decade’.
The Standish Group’s interpretation of its data is not without its critics. The January/February 2010 issue of IEEE Software magazine carried an article entitled ‘The Rise and Fall of the Chaos Report Figures’.3 It was written by Professor Chris Verhoef and PhD student J. Laurenz Eveleens, at the time in Vrije Universitiet Amsterdam’s Department of Computer Science. Their main criticism seems to relate to the way in which the Standish Group classifies projects as failures or successes. They argue that classifying a project as a failure because it exceeds its budget or schedule is meaningless if the original estimates of cost, schedule and functionality were poor in the first place. They go on to say that:
The part of a project’s success that’s related to estimation deviation is highly context dependent. In some contexts 25% estimation error does no harm and doesn’t impact what would normally impact project success. In other contexts, only 5% overrun would cause much harm.
This is all well and good, but it is scant consolation for business managers who have to use estimates of cost, schedule and functionality to justify projects in their business cases.
But in any event, the 2010 CHAOS Manifesto only uses the term ‘failure’ for projects that were cancelled or delivered something that was never used. Other projects are classified as either ‘challenged’ or ‘successful’. Their classification criteria might have been looser in previous years, but whether a project that exceeds its budget by 25 per cent is a failure or not seems a little academic. The data still says that only a third of projects deliver what was expected on time and on budget.
The other (private) criticism I have heard is that because the Standish Group is selling a service based on its data that advises clients how to achieve better project outcomes, it has a vested interest in painting a dire picture. This begs the question as to whether independent research supports the Standish Group’s conclusions. The answer is yes it does, and it comes from the British Computer Society and the Saïd Business School at the University of Oxford.
THE BRITISH COMPUTER SOCIETY
The British Computer Society (BCS) is the UK’s professional body for IT. In 2008, it published the results of research that looked a 214 projects, covering the period 1998–2005, across a range of sectors within the European Union.4 The findings are summarised in Figure 1.1 on the following page. An overrun represents a schedule or cost overrun or both.
The figures show that 24 per cent of projects were cancelled after significant expenditure. This is exactly the same figure reported by the Standish Group. It also shows that 44 per cent of projects were delivered on time and to budget, a better performance than the 32 per cent reported by the Standish Group, though not a million miles away and hardly a cause for celebration.
What really jumped out at me, however, was that 23 per cent of projects overran their budget by 70 per cent or more. Add in the 24 per cent of projects that were cancelled after significant money was spent and pretty close to half of the projects went very badly wrong.
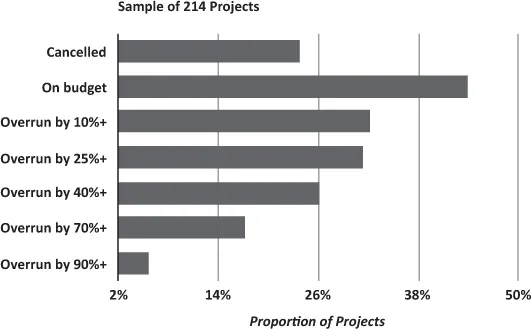
Figure 1.1 Results of the British Computer Society survey of project failure
Note: The overrun bars are cumulative, such that ‘overrun by 10%+’ includes all of those projects that have overrun by 10 per cent or more, so it includes those projects that have overrun by 25 per cent, 40 per cent, 70 per cent and 90 per cent. Similarly, ‘overrun by 25%+’ includes projects that overrun by 40 per cent, 70 per cent, 90 per cent and so on for the other bars.
This bleak assessment is further supported by the most recent research from the Saïd Business School.
THE SAÏD BUSINESS SCHOOL
The September 2011 issue of Harvard Business Review published an article entitled ‘Why Your IT Project May Be Riskier Than You Think’.5 It was coauthored by Bent Flyvbjerg, the Professor and Chair of Major Programme Management at the Saïd Business School.
The article reported the initial findings of a study of 1,471 projects worldwide. It found that the average project budget overrun was only 27 per cent, but that:
Fully one in six of the projects we studied was a black swan, with a cost overrun of 200 per cent, on average, and a schedule overrun of almost 70 per cent.
This tells us that we should expect most of our IT projects to overrun. Sometimes, however, they will overrun massively. Note that the 200 per cent figure is the magnitude of the overrun, such that a £5 million budget turns into a £15 million cost. You might wonder how a project can become 200 per cent overbudget without someone pulling the plug. Unfortunately, the article doesn’t address this question, but in my experience it is a combination of reasons. Foremost is the belief that so much money has been spent so far that it would be a waste to ‘give up now, with the end in sight’. Unfortunately, the end often remains in sight for a considerable amount of time but never arrives.
Incidentally, the term ‘black swan’ comes from Nassim Nicholas Taleb’s book The Black Swan: The Impact of the Highly Improbable.6 Taleb describes a black swan as an event that is ‘outside the realm of regular expectations … carries an extreme impact … [and is] after the fact explainable and predictable’. This definition will sound very familiar to anyone who has been close to a significant IT project disaster.
Here are three (of many) examples:
• British retailer Sainsbury’s ‘Warehouse Automation’ project made it into production in 2003, but was later scrapped in 2005, with a reported write-off of £260 million.7
• The Federal Bureau of Investigation’s ‘Virtual Case File’ Project was written off after an expenditure of $170 million in 2005.8
• In July 2006, the CEO of Anglo-French Clearing House LCH. Clearnet departed when his company wrote off €47.8m after scrapping a failed three-year project to build an integrated clearing platform.9
Can You Defy the Statistics?
Taken together, the studies summarised above tell us that a majority of IT projects overrun, usually by 25 per cent or more, and sometimes when they go wrong, they go very badly wrong. Some people argue that this is simply a question of estimating error. But if your business case depends on the estimate and the project turns out to cost twice as much as you thought it would, then that’s pretty serious.
So, do you believe the statistics? If you are like most people, you will fall into one of two camps, depending on whether you are observing someone else’s project or whether it is your own project, setting out to achieve an important business outcome. The first time I pulled together this data was for a talk to a class of MBA undergraduates. I had a slide prepared that said something like: ‘Only 32 per cent of IT projects deliver what was wanted, on time and budget – one in six overrun by 200 per cent or more’. I was ready to shock them.
‘So’, I asked them, ‘what proportion of IT projects do you think deliver what was expected on time and budget?’ I moved to the flip-chart to plot the distribution of their answers. ‘Zero’, someone shouted. I laughed. ‘Five per cent’, shouted another person. My laugh got a bit more nervous, as my presentation storyline evaporated. The final consensus of the 80 or so business students was that no more than 10 per cent of projects deliver what is needed to schedule and budget. When it’s not our project, we are very pessimistic about IT projects.
We seem transformed when it is our own project; that innate optimism bias described by Tali Sharot10 kicks in. Like most car drivers, we believe that accidents will not happen to us because we are better than average drivers. Accidents happen to other people because they are careless and, let’s be honest, not as smart as we are. Studies show that people have a problem applying statistical generalisations to themselves. Perversely, however, we tend to generalise from very few personal experiences, be they good or bad.11
So, do you believe you can defy the statistics? Is there really no alternative to an IT project? Let me throw in one last statistic about project size from the Standish Group before considering some common scenarios that beg for an alternative. In its database of 70,000 projects, the Group found that projects with a staff cost of:
• less than $750,000 have a 71 per cent chance of coming in on time and on budget;
• between $750,000 and $3 million have a 38 per cent of coming in on time and on budget;
• over $10 million have a two per cent chance of coming in on time and on budget.
This chimes with research that I carried out earlier in my career. I found that the productivity of IT project teams declined exponentially as project size increases. Small is definitely beautiful when it comes to IT projects. In Chapter 4 I will be recommending that you break your projects down into chunks, each of which delivers usable value.

Figure 1.2 Productivity versus project size
Seriously Considering Alternatives
The sections that follow illustrate some common scenarios where an IT project could have been avoided, or at least minimised, to a great extent.
AVOIDING THE COST OF BUYING A SERVICE
I was once asked to rescue a project in trouble. It had a ‘fixed deadline’ and the project manager gave it a 70 per cent chance of being delivered on time. This was actually his way of saying that it would not deliver on time. I was asked by the business executive responsible to ‘take over the project and drive it to a successful conclusion’. I asked the executive about the project drivers and he was a bit sketchy, which made me somewhat suspicious. I agreed to undertake an assessment of the project before deciding whether to take on the role.
I discovered that the project came about because a supplier of essential business data had proposed a 50 per cent price increase for the service. Needless to say, everyone in the client company was mightily irritated. At a brainstorming session a couple of days after the increase was proposed, one of the IT team suggested that the company could...
Table of contents
- Cover Page
- Dedication
- Title Page
- Copyright Page
- Contents
- List of Figures
- List of Tables
- About the Author
- Acknowledgements
- Introduction
- 1 Don’t Do IT
- 2 Stepping Up to the Plate
- 3 Defining a Shared Project Vision
- 4 Value-Based Delivery
- 5 Generating Solution Options
- 6 The Business Case as a Management Tool
- 7 Project Delivery
- 8 Conclusion: A Team of Leaders
- Appendix A: Solution Workshops
- Appendix B: Glossary
- Appendix C: Net Present Value (NPV) Primer
- References
- Index
Frequently asked questions
Yes, you can cancel anytime from the Subscription tab in your account settings on the Perlego website. Your subscription will stay active until the end of your current billing period. Learn how to cancel your subscription
No, books cannot be downloaded as external files, such as PDFs, for use outside of Perlego. However, you can download books within the Perlego app for offline reading on mobile or tablet. Learn how to download books offline
Perlego offers two plans: Essential and Complete
- Essential is ideal for learners and professionals who enjoy exploring a wide range of subjects. Access the Essential Library with 800,000+ trusted titles and best-sellers across business, personal growth, and the humanities. Includes unlimited reading time and Standard Read Aloud voice.
- Complete: Perfect for advanced learners and researchers needing full, unrestricted access. Unlock 1.5M+ books across hundreds of subjects, including academic and specialized titles. The Complete Plan also includes advanced features like Premium Read Aloud and Research Assistant.
We are an online textbook subscription service, where you can get access to an entire online library for less than the price of a single book per month. With over 1.5 million books across 990+ topics, we’ve got you covered! Learn about our mission
Look out for the read-aloud symbol on your next book to see if you can listen to it. The read-aloud tool reads text aloud for you, highlighting the text as it is being read. You can pause it, speed it up and slow it down. Learn more about Read Aloud
Yes! You can use the Perlego app on both iOS and Android devices to read anytime, anywhere — even offline. Perfect for commutes or when you’re on the go.
Please note we cannot support devices running on iOS 13 and Android 7 or earlier. Learn more about using the app
Please note we cannot support devices running on iOS 13 and Android 7 or earlier. Learn more about using the app
Yes, you can access Business Leadership for IT Projects by Gary Lloyd in PDF and/or ePUB format, as well as other popular books in Business & Business General. We have over 1.5 million books available in our catalogue for you to explore.