![]()
chapter one
Guns in America
As noted in the introduction, my dad has three guns in his house. I have none. Unfortunately, that is the extent of information that I possess on the supply of guns in America. Authorities probably even know less than I do about the supply of guns in Pennsylvania. The reasons are varied. First, since there is no national registry of firearms, except for certain very dangerous weapons, there is no information on who owns what firearms in the United States. Second, although federally licensed firearms dealers are required to maintain records on every firearm transfer, they do not have to notify authorities regarding the transfers. In fact, federal law prohibits the creation of a central repository of firearm sales records (Firearm Owner’s Protection Act, 1986). Second, approximately 40% of all firearm transfers are between private parties (Cook and Ludwig 1997). It is important to note that the 40% value is a rough estimate based on survey data. Given that no background checks are required for private transfers, there is no way to verify this estimate. Third, in private firearm transfers, neither the seller nor the buyer of the firearm is obligated to report the sale to the authorities. In only 11 states and the District of Columbia are sellers required to report transfers of firearms to the authorities. In five of those states, all firearm transfers must be reported. In the remainder of the states, only handgun transfers need to be reported. Fourth, although federal law requires dealers to maintain the records of firearm transfers indefinitely, background check records are destroyed quickly. All information on approved transfers must be destroyed within 24 hours upon the notification of the background check approval. Information on denials is retained by the Federal Bureau of Investigation (FBI) indefinitely.
Fifth, very few states require all firearms to be registered. Only Hawaii and the District of Columbia require that all firearms be registered. New York requires that handguns and assault weapons have to be registered, and, in California, Connecticut, Maryland, and New Jersey, only assault weapons have to be registered. Given all of the above, it is very difficult for law enforcement or any state or federal authority to determine the supply of firearms in the United States.
The only firearms in the United States that have to be registered with federal authorities are those that are covered by the National Firearms Act (NFA) of 1934. The NFA was enacted in response to killings that were perpetrated by organized crime syndicates and other criminals, such as Al Capone. Although the intent of the law was to reduce the supply of weapons such as machine guns, shortened long guns, and silencers, the act was presented to the public and Congress as a tax bill. A $200 tax was imposed on the sale and transfer of most NFA firearms. This tax is still in existence, and it is still $200 per transfer. Given that the dollar value of the tax has not changed, the negative effect of the tax on the demand for NFA weapons has diminished somewhat.
In addition to the tax, owners of NFA firearms and weapons have to register their weapons with the Bureau of Alcohol, Tobacco, Firearms, and Explosives (BATF). In 1986, the Firearm Owners’ Protection Act was passed, which amended the definition of a silencer and prohibited the transfer and possession of machine guns, except for government agencies and those machine guns that were lawfully possessed before May 19, 1986.
Given the required registration of NFA weapons, the federal government knows with a great deal of precision how many NFA weapons are currently in existence in the United States. According to the BATF, in February of 2015, there were 543,073 machine guns; 2,446,984 destructive devices, which include bombs, grenades, and mines; 792,282 silencers; 181,314 short-barreled rifles; and 138,393 short-barreled shotguns. The states with the largest number of NFA weapons are, in descending order, Texas, California, Virginia, Florida, and Pennsylvania. The states with the fewest number of NFA weapons are Rhode Island, Delaware, Vermont, Hawaii, and North Dakota.
Unfortunately, for non-NFA firearms, we do not know how many exist in the United States, let alone how many exist in each individual state or county. Most studies on gun ownership use proxy variables for gun supply. Some studies use subscription rates for gun magazines or NRA memberships (Kleck and Patterson 1993). Others use survey data (Kleck and Hogan 1999; Miller et al. 2002, 2006; Moody and Marvell 2005; Gius 2009, 2011). One study uses background checks as a proxy for gun prevalence (Lang 2013). Finally, some studies use the ratio of firearm suicides to total suicides.
It is important to note that none of these proxy variables include information on how many guns are in a given state or region. In the case of survey data, most only ask if there is a firearm in the respondent’s residence. There are no survey questions regarding how many firearms a respondent owns. The other proxy measures (magazine subscriptions, NRA memberships, background checks, and firearm suicide ratios) are measures of firearm prevalence and contain no information on the number of firearms in circulation. Given that survey data provide the best information on actual gun ownership, several of the more commonly used surveys will be examined.
One of the more frequently used surveys in the gun prevalence literature is the General Social Surveys (GSS). The GSS is a survey on the demographic characteristics and social attitudes of U.S. residents and is administered by the National Opinion Research Center (NORC) located at the University of Chicago. It has been conducted annually from 1972 to 1994, except for the years 1979, 1981, and 1992, and biennially beginning in 1994. As of 2014, data on over 59,000 respondents and almost 6000 variables have been collected. The survey questions encompass a wide variety of subject matter, including the respondents’ demographic information and their opinions on matters ranging from government spending to the state of race relations. The GSS uses primarily in-person interviews. With regards to firearms, several questions are asked on the GSS. The two most relevant questions are as follows:
1. “Do you happen to have in your home any guns or revolvers?”
2. “Do any of these guns personally belong to you?”
Unfortunately, there are no questions on how many firearms a respondent owns. In addition, one problem with the GSS data is the relatively small number of responses to these questions. In the 2014 survey, only 1657 individuals answered the question “Do you happen to have in your home any guns or revolvers?” Although potentially large enough for an analysis of national data, there are not enough responses to infer gun ownership at the state or regional level. The GSS is only suitable for a national or regional analysis of gun ownership. No state-level analyses should be attempted with these data.
Another commonly used survey in the gun prevalence literature is the Behavioral Risk Factor Surveillance System (BRFSS). The BRFSS is a data collection program that is administered by the Centers for Disease Control and Prevention and the U.S. states and territories. This program, which began in 1984, measures and collects data on the behavioral risk factors of adults. No question is asked regarding the number of guns in a given household. The firearm questions, which are similar to those asked in the GSS, only deal with whether or not a household has guns. The most relevant question in the BRFSS is as follows:
“Are any firearms now kept in or around your home?”
Unfortunately, the questions on firearms were only asked in seven years of the survey, the latest being 2004. Hence, the data regarding gun ownership are somewhat dated.
A seldom-used survey in the gun prevalence literature is the National Longitudinal Survey of Youth (NLSY). The NLSY was constructed to be a nationally representative sample of the civilian noninstitutionalized population at the time of the initial survey in 1979. A second survey with a different cohort was started in 1997. The 1979 NLSY consisted of 12,686 men and women between the ages of 14 and 22 when the survey was started in 1979. The 1997 NLSY consisted of 8984 men and women between the ages of 12 and 16 when the survey was started in 1997. The NLSY employs extensive household interviews in the selected sampling areas in order to obtain as random and as representative a sample as possible.
Unfortunately, there are several drawbacks regarding the use of the NLSY in gun supply research. First, not all ages are represented in the sample. In the 1997 NLSY, there is only a very narrow age range of five years. Hence, the results obtained from such a data set may not be applicable to the population in general. Second, there are no questions on gun ownership. All of the questions deal with whether the respondent carried a gun since the last interview or in the past 30 days. It is unknown if the gun was owned by the respondent, nor is it known how many guns the respondent owns. Finally, the gun questions in the NLSY elicited very few responses, thus resulting in such a small data set that most statistical analyses would be impractical.
In order to develop a more accurate measure of gun ownership, Lang (2013) used background check data as a measure of the change in the stock of firearms for a given state. This unique proxy variable for gun prevalence has its roots in the Brady Handgun Violence Prevention Act (Brady Act) of 1993. Starting in February of 1994, the federal government required all buyers of handguns to undergo a background check in order to determine if the potential buyer is legally allowed to possess a gun. The reasons why a person may fail a background check include felony convictions, felony indictments, domestic violence misdemeanors, restraining orders, fugitive status, illegal alien status, mental illness or disability, drug addiction, and local or state prohibition. From February of 1994 to November of 1998, the act only applied to handgun sales. In November of 1998, the permanent provisions of the Brady Act took effect. These permanent provisions established the National Instant Criminal Background Check System (NICS) and extended the act’s provisions to purchasers of long guns and to persons who redeem pawned firearms. States have the option of conducting their own background checks, or they may have the checks performed by the FBI. From 1994 to 2009, only 1.8% of firearm sales were denied. Finally, the Brady Act does not require background checks for firearm purchases that are conducted through unlicensed firearm dealers (private sales), although several states require background checks for private sales.
In his analysis of the relationship between background checks and suicide rates, Lang (2013) used state-level data on background checks as a proxy for gun availability. The author compared this proxy variable to several more commonly used proxies and found a strong positive correlation between background checks and these more established gun supply proxies. There are, however, several issues with using this variable as a proxy: Many states do not require the registration or licensing of firearms, private gun purchases are exempt from background checks, firearm dealers may not comply with the law, and, finally, there may be private transfers of guns across state lines. Nonetheless, Lang notes that background checks measure the intent to purchase a gun and hence serve as a proxy for the change in gun availability over time.
Although it is a unique approach to estimating firearm prevalence, the primary problem with this estimating methodology is that it only provides an estimate of the change in the stock of firearms, but provides no indication about how many firearms are owned in total. Given that firearms are durable goods, guns that were sold decades ago could still be in use. Hence, looking at annual sales (background checks) only captures a very small part of the supply of firearms in the United States.
One final approach that is used to estimate the supply of firearms in the United States is the use of production and trade data on firearms. Brauer (2013), in his working paper “The U.S. Firearms Industry,” examines the economic characteristics of the U.S. firearms industry. Utilizing data from the BATF, the FBI, the U.S. Customs and Border Protection, and the U.S. Census Bureau, Brauer attempts to estimate the number of firearm producers, the number of firearms produced, industry consolidation, foreign competition, international trade, and the overall market structure of the U.S. firearm industry. Using data from 1986 to 2010, the author finds that there were more than 2200 firearm producers, a net domestic production of more than 98 million (net of exports), and imports of at least 48 million. His analysis shows that for every year, during the period in question, the supply of firearms in the United States increased by 6 million units. In addition, more than 1.5 million used firearms changed hands in 2010.
It is important to note, however, that Brauer was unable to determine the actual number of firearms in the United States. The reasons for this are many but primarily are due to the lack of reliable firearm supply data. As noted earlier, there is no national registry of firearms and, given that guns are durable goods, looking at background checks or production data only provides information on the change in the supply of firearms and not on the actual number of firearms.
The one piece of information that the survey data (GSS and BRFSS) can provide us is an estimate of the percentage of persons who own a gun in the United States. For the GSS data, the relevant question is as follows:
“Do you happen to have any guns or revolvers in your home?”
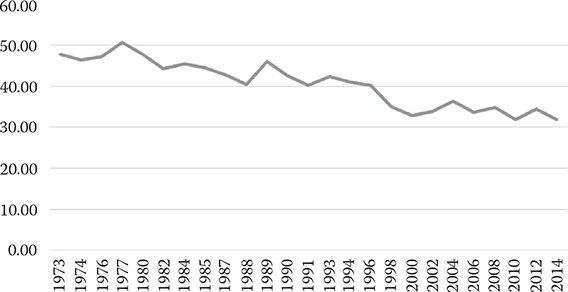
Data are presented in Figure 1.1.
According to these data, the percentage of Americans having a gun in their home was approximately 50% in the early 1970s but then dropped at a fairly steady rate until, in 2014, only 31% of Americans claimed to have a gun in their house.
In looking at the BRFSS data, the relevant question is as follows:
“Are any firearms kept in or around your home?”
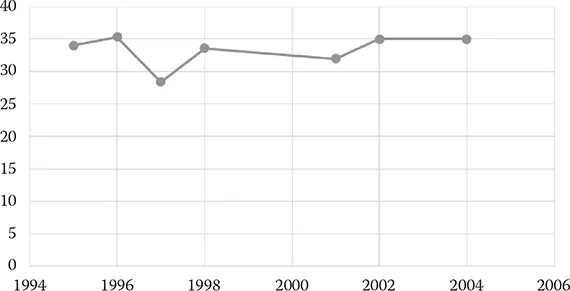
Unfortunately, the only years in which this question was asked were 1995, 1996, 1997, 1998, 2001, 2002, and 2004. The available data are presented in Figure 1.2.
The BRFSS survey findings are similar to those of the GSS data and suggest that approximately 30%–35% of Americans have a gun in their home. Unfortunately, for neither survey do we have any information on how many guns are in the respondents’ homes.
In conclusion, although some prior studies have attempted to develop proxy measures of gun ownership (Kleck and Patterson 1993; Duggan 2001; Miller et al. 2002; Bugg and Yang 2004; Moody and Marvell 2005; Gius 2008), no researcher has yet been able to obtain data on actual gun ownership levels in the United States. Proxy measures used in prior research include the subscription rates of gun and hunting magazines, the number of National Rifle Association (NRA) members per 100,000 persons, firearm-related suicide rates, and national survey data (GSS and the BRFSS). Unfortunately, none of these proxies provide an adequate estimate of the number of guns in a particular state or county. Without such data, it is difficult to determine a variety of statistical relationships, including the relationship between gun ownership and gun-related crime.
Figure 1.1 Percentage of Americans that have a gun in their home. Source: GSS.
Figure 1.2 Percentage of Americans that have a gun in their home. Source: BRFSS.
Another interesting question regarding gun ownership is the issue of why some persons feel compelled to own guns and others do not. There have been several studies that have examined the determinants of gun ownership. Kalesan et al. (2016) use survey data from 2013 in order to determine if there is a relationship between social gun culture and gun ownership. The authors defined gun culture exposure by using responses from four survey questions. Their results suggest that there is a strong association between social gun culture and gun ownership. In other words, individuals who have family or friends who use guns are more likely to own guns themselves.
Bugg and Yang (2004) looked at trends in the gun ownership of women. Using data from the GSSs for the period 1973–2002, the authors found that gun ownership by women, has declined during the period in question. In examining the determinants of gun ownership, the authors found that older white women who are Republican and who live in rural areas are more likely to own guns than other women. In addition, better educated women are less likely to own guns, but higher-income women are more likely to own guns.
Ross (2001) looked at the effects of environmental factors on the probability that a person would own a gun. Using survey data on 2482 Illinois adults, the author found that the only neighborhood characteristic that was significantly related to individual gun ownership was the percentage of the neighborhood population that was college educated. The greater this percentage, the lower the probability of gun ownership. In addition, married whites and African-Americans living in rural areas are more likely to own guns than others.
Finally, Cao et al. (1997), using survey data from Cincinnati, Ohio, found that men who were exposed to a social gun culture as children are more likely to own guns. Individuals who own guns for protection did so because of neighborhood safety issues and a conservative crime ideology.
Even though this research on the determinants of gun ownership is important, it is still no substitute for actual data on gun prevalence in the United States. The lack of data on gun supply hinders the analysis of the impact of gun control laws on crime. Because of this lack of data on gun supply, we cannot ascertain with any precision the impact of guns on crime, nor can we determine the effects of gun control measures on the supply of firearms. Granted, the analyses of many public policies involve sample, rather than population, data. For example, sampling is used to determine the unemployment rate in a given state or city. However, an important distinction between the collection of unemployment data and the collection of data on gun supply is that employment data are collected on a regular basis by a gover...