eBook - ePub
The Quest for Quality in the NHS
A Chartbook on Quality of Care in the UK
- 232 pages
- English
- ePUB (mobile friendly)
- Available on iOS & Android
eBook - ePub
The Quest for Quality in the NHS
A Chartbook on Quality of Care in the UK
About this book
PUBLISHED IN ASSOCIATION WITH THE NUFFIELD TRUST Quality is an issue of central importance in the NHS and yet, despite a considerable number of initiatives, programmes and organisation that have focussed on improving quality in the NHS over recent years, there's no comprehensive, reliable balance and rigorous account of the strengths and weaknesses in healthcare delivery. This book provides an authoritative and accessible account of the state of quality in the NHS. Unless information on quality is properly gathered, organised, analysed and used, the health service will continue to lack a foundation on which sustained and systemic improvement can be based. The Quest for Quality in the NHS: a chartbook on quality of care in the UK is a comprehensive, rigorous and robust account of healthcare quality and will inform the public, managers, researchers and policymakers about gaps between what is possible, and what is delivered by the healthcare system.
Trusted by 375,005 students
Access to over 1.5 million titles for a fair monthly price.
Study more efficiently using our study tools.
Information
Topic
Medicine1 Effectiveness
Effectiveness refers to the extent to which an intervention produces its intended result. Effectiveness in the context of the quality of healthcare also encompasses the concept of appropriateness, the extent to which interventions or services, based on scientific knowledge, are provided to all those who could benefit and withheld from those who would not (Hurtado et al., 2001). Effectiveness indicators can focus on outcomes such as mortality or survival rates that reflect the success of preventive measures, diagnosis and treatment; or on processes that have been proven to affect those outcomes and can be used as more immediate measures of quality, for example the use of thrombolysis in the treatment of heart attacks.
We have organised the effectiveness charts into six sections, primarily on the basis of five disease groups and one type of service. They are:
1cancer
2circulatory disease
3diabetes
4infectious disease
5mental health
6surgery.
Preceding those sections is a chart that focuses on avoidable mortality which reflects quality across the entire healthcare sector.
Chart 1.1 Mortality from causes considered amenable to healthcare
Measures of avoidable mortality are used to gauge the extent to which healthcare services save lives and contribute to population health. Avoidable mortality is the number of deaths that should not occur in the presence of effective and timely healthcare (Nolte and McKee, 2004). It tallies deaths from conditions that are amenable to treatment and medical care (i.e. with appropriate treatment there should be no deaths, e.g. appendicitis) and those that are preventable (i.e. there are effective means to prevent the condition occurring, often through behavioural and lifestyle changes, e.g. smoking-related lung cancer). Chart 1.1a shows international comparisons on amenable death rates for those aged 0–74 (both including and excluding figures for ischaemic heart disease (IHD)). The UK had the highest rates of the five countries shown. Chart 1.1b shows a time series of mortality rates in England and in Wales (data include IHD). Wales has had a consistently higher mortality rate, but both countries have seen a steady decline in rates, reflecting improvements in healthcare over time.
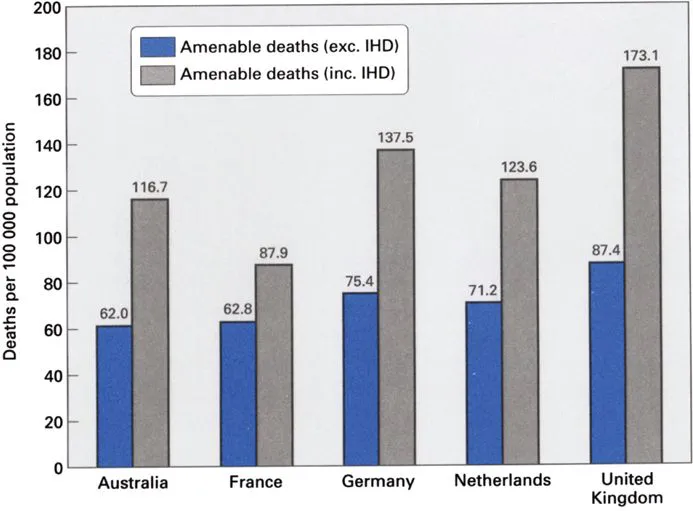
Source: Nolte and McKee, 2004; Korda and Butler, 2004.
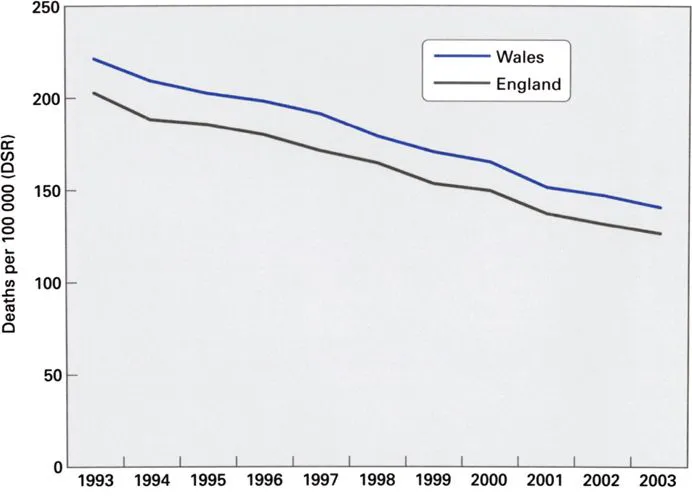
Source: ONS; NCHOD (analysis by Lakhani, Eayres and Coles).
Cancer overview
Cancer arises from abnormal and uncontrolled cell division. The proliferating cells subsequently invade and destroy the surrounding tissues. Spread of cancer (metastasis) may occur via the bloodstream or the lymphatic system or across body cavities such as the pleural and peritoneal spaces, resulting in secondary tumours.
In 1999–2001, the average annual number of new cancer cases registered in the UK was 269 631 (133 697 for males; 135 934 for females). Incidence rates varied within the countries of the UK with the highest incidence for males occurring in Wales and for females occurring in Scotland (see Table 1.1).
One in three people develop cancer at some time in their lives (Summerfield and Babb, 2004). Cancer is responsible for around one-quarter of all deaths in the United Kingdom. In England and Wales, there were 136 777 cancer deaths in 2002 (ONS, 2004a: pp128–9); and in Scotland 15 063 cancer deaths in 2003 (ISD Scotland, 2004).
Cancer is predominantly a disease of the elderly. Only 0.5% of cases registered in 2001 were in children (aged under 15) and 25% were in people aged under 60 (ONS, 2004c).
The charts in this section display data on mortality, survival and screening rates for the most common types of cancer.
Table 1.1 Incidence per 100 000 population (age-standardised, average rates 1999–2001)
Males | Females | |
|---|---|---|
UK | 403.4 | 343.0 |
England | 398.6 | 339.1 |
Wales | 437.8 | 357.6 |
Scotland | 431.2 | 370.1 |
Northern Ireland | 392.1 | 345.0 |
Source: ONS, 2004b.
Chart 1.2 Cancer mortality rates
Comparisons of mortality rates can give some indication of quality of healthcare, but should be interpreted carefully because many other factors, such as lifestyle, genetics and behaviour, also contribute to mortality rates. Comparative data can however give insight into the extent to which deaths may be amenable to healthcare or preventable. The chart shows that since 1990 mortality rates from cancer have fallen more sharply in the UK than in many other countries, a 12% drop compared to 9% in Australia, 7% in the US and Germany, and 5% in Sweden and France. However, the most recently available OECD data shows that the UK mortality rate was still high relative to comparator countries. In 1999 184.7 deaths per 100 000 were attributed to cancer in the UK, compared to 151.3 deaths per 100 000 in Sweden.
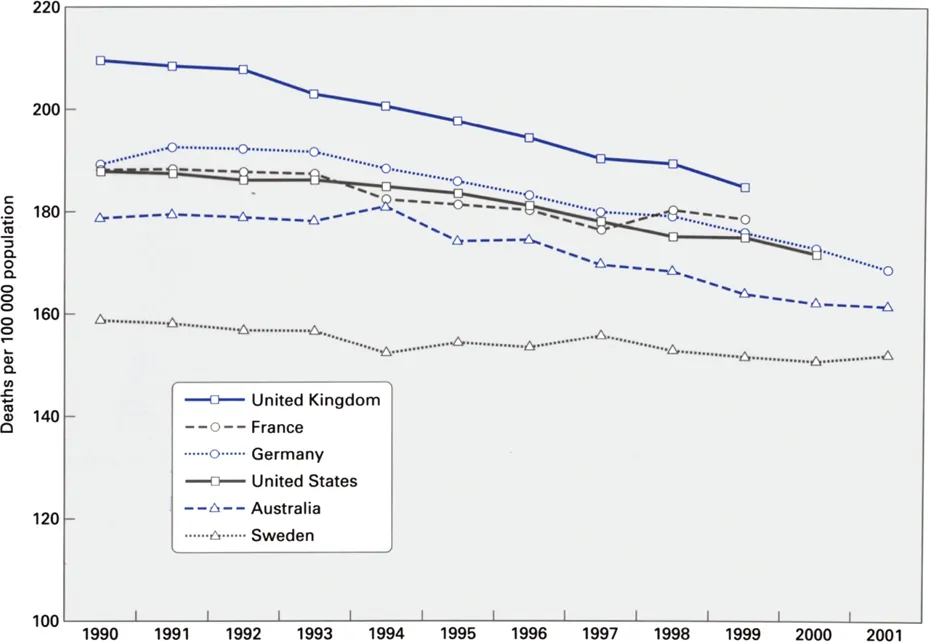
Source: OECD, 2004.
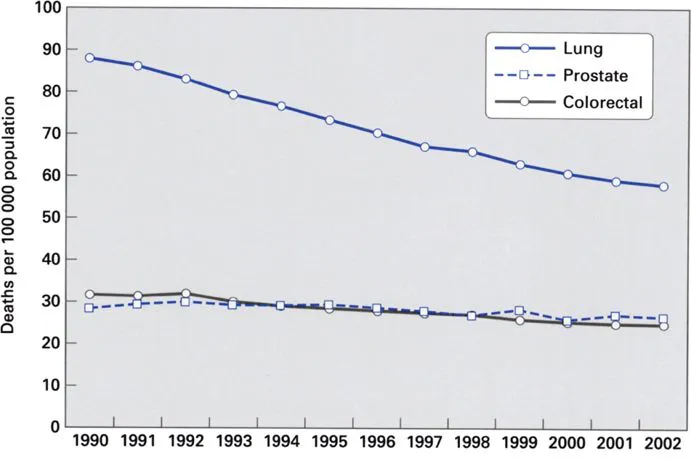
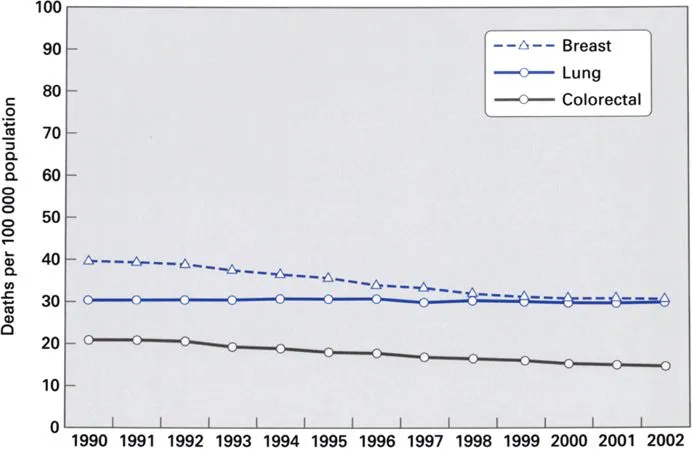
Chart 1.3 Mortality rates from common cancers, UK time series
The four most common cancers – colorectal, lung, breast and prostate – account for more than half of all cancers registered each year (ONS, 2004c). These charts show that mortality rates for these cancers have declined since 1990. Particularly noteworthy is the data on lung cancer; with a marked decrease in the death rate among males (from 87.9 deaths per 100 000 in 1990 to 58.3 deaths per 100 000 in 2002) and little change among females (from 30.6 deaths per 100 000 in 1990 to 29.9 deaths per 100 000 in 2002). The decrease in lung cancer mortality overall echoes a similar decrease in smoking rates, attesting to the major influence that lifestyle changes have on mortality (Summerfield and Babb, 2004).
Source: ONS.
Source: ONS.
Chart 1.4 Premature deaths from cancer: progress against a target
The Government set a target in 1999 to reduce by 20% the death rate from cancer in people under age 75 by 2010, using 1995–97 data as a baseline (DH, 1999a). As of 2002, a 10% reduction in the rate of deaths had been achieved. A decline in...
Table of contents
- Cover
- Title Page
- Copyright Page
- Table of Contents
- The Nuffield Trust
- Foreword
- Acknowledgements
- Authors’ biographies
- Summary of charts
- Introduction
- Guide to the charts
- 1 Effectiveness
- 2 Access
- 3 Capacity
- 4 Safety
- 5 Patient-centredness
- 6 Disparities
- Technical appendix
- Search strategy
- Statistical glossary
- Acronyms
- Index
Frequently asked questions
Yes, you can cancel anytime from the Subscription tab in your account settings on the Perlego website. Your subscription will stay active until the end of your current billing period. Learn how to cancel your subscription
No, books cannot be downloaded as external files, such as PDFs, for use outside of Perlego. However, you can download books within the Perlego app for offline reading on mobile or tablet. Learn how to download books offline
Perlego offers two plans: Essential and Complete
- Essential is ideal for learners and professionals who enjoy exploring a wide range of subjects. Access the Essential Library with 800,000+ trusted titles and best-sellers across business, personal growth, and the humanities. Includes unlimited reading time and Standard Read Aloud voice.
- Complete: Perfect for advanced learners and researchers needing full, unrestricted access. Unlock 1.5M+ books across hundreds of subjects, including academic and specialized titles. The Complete Plan also includes advanced features like Premium Read Aloud and Research Assistant.
We are an online textbook subscription service, where you can get access to an entire online library for less than the price of a single book per month. With over 1.5 million books across 990+ topics, we’ve got you covered! Learn about our mission
Look out for the read-aloud symbol on your next book to see if you can listen to it. The read-aloud tool reads text aloud for you, highlighting the text as it is being read. You can pause it, speed it up and slow it down. Learn more about Read Aloud
Yes! You can use the Perlego app on both iOS and Android devices to read anytime, anywhere — even offline. Perfect for commutes or when you’re on the go.
Please note we cannot support devices running on iOS 13 and Android 7 or earlier. Learn more about using the app
Please note we cannot support devices running on iOS 13 and Android 7 or earlier. Learn more about using the app
Yes, you can access The Quest for Quality in the NHS by Sheila Leatherman,Kim Sutherland in PDF and/or ePUB format, as well as other popular books in Medicine & Medical Theory, Practice & Reference. We have over 1.5 million books available in our catalogue for you to explore.