eBook - ePub
Economic Lessons from the Transition: The Basic Theory Re-examined
The Basic Theory Re-examined
- 261 pages
- English
- ePUB (mobile friendly)
- Available on iOS & Android
eBook - ePub
Economic Lessons from the Transition: The Basic Theory Re-examined
The Basic Theory Re-examined
About this book
Economic Lessons from the Transition focuses on major transitions in the 1990s: the transition from central planning and communism to market capitalism and the global integration of national financial systems. The transitions were supposed to raise most peoples' standard of living; instead they dramatically worsened the lives of most people in the countries involved. While most attempts to explain this failure focus on policies, the authors of this book argue that failure of economic theory to fully understand these transitions has led to bad policies that made the transitions unnecessarily painful and costly. The book suggests answers to the following questions: How should basic economic theory as taught in introductory economics courses be revised in light of the failure of market-oriented economics to effect a successful transition in so many former communist economies? Could the theory be revised and presented in a different manner? How can basic economic theory be used to help explain the past failures in understanding transition problems and to avoid future mistakes? This volume is a "must read" for all who teach economics or apply economics to the real world.
Trusted by 375,005 students
Access to over 1.5 million titles for a fair monthly price.
Study more efficiently using our study tools.
Information
1
The Basic Market Mechanism
The heart of the market mechanism is the interaction, in fact, the intersection, of supply and demand. This is the first thing that all economics students learn in their first principles course, so we will not go over it in detail. However, it is interesting to see what this theory has to say about transition economies, and posit some changes to the theory to explain what happened there.
The key to a functioning market is that both buyers and sellers are sensitive to price, but in opposite directions. As the price rises, sellers offer more units of the good for sale, while buyers are willing to buy fewer units. For example, assume a simple market in which only one kind of good is for sale. There are nine buyers and nine sellers: each of the buyers wants one unit, and each seller has one unit to sell.
In this textbook example of supply and demand, each seller has a different price that she is willing to take for her good and each buyer has a different price that she is willing to pay. For example, at a price of 9 euro, nine sellers are willing to sell, but only one buyer is willing to buy. If the price falls to 8 euro, one high-cost producer drops out, so only eight units are offered for sale. However, at 8 euro, another customer is willing to buy a unit of the good, so quantity demanded rises to two units.
Continue this process, and the result is the schedule of quantities supplied and demanded at each price given below (see Table 1.1).
The same information is displayed in Graph 1.1, with price on the vertical axis, and quantities supplied and demanded on the horizontal axis. The quantity supplied equals the quantity demanded at only one price, 5
Table 1.1
Schedule of Quantities Supplied and Demanded
Schedule of Quantities Supplied and Demanded
| Price in Euros | Quantity Supplied | Quantity Demanded |
| 9 | 9 | 1 |
| 8 | 8 | 2 |
| 7 | 7 | 3 |
| 6 | 6 | 4 |
| 5 | 5 | 5 |
| 4 | 4 | 6 |
| 3 | 3 | 7 |
| 2 | 2 | 8 |
| 1 | 1 | 9 |
euro. This is also the price at which the supply curve and the demand curve intersect, the equilibrium price for this market. The equilibrium quantity for this market is five units. The term “equilibrium” is also significant. Economics demonstrates that markets move toward the equilibrium point, due to the independent actions of market participants (see Graph 1.1).
This intersection of supply and demand is absolutely the key principle of market economics. Equilibrium is found, not because of the actions of some third party (i.e., the government), but because the independent and rational actions of each market participant lead to this conclusion. Notice that not all of the goods are sold and not every buyer goes home with something in their basket. Only those willing to buy and sell at 5 euro make transactions on the market that day.
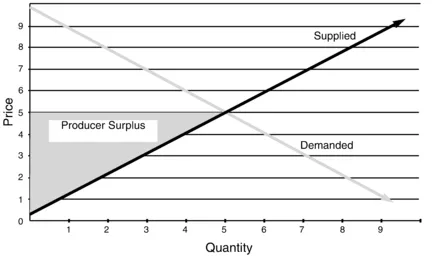
Another key principle of economics is that surplus results from a well-functioning market. In the example above, most of the producers and consumers who make a transaction get a surplus. This is because each buys or sells at the 5-euro equilibrium price, not at their worst acceptable individual price. The lowest-cost supplier, willing to sell her unit for 1 euro, gets the 5-euro equilibrium price. The extra 4 euros that she gets is a bonus—what economists call a surplus. The next lowest-cost producer, willing to sell for 2, also sells for 5, and gets a producer surplus of 3. And so on. Thus, five active producers and sellers collect a total surplus of 10 euro. This is shown in Graph 1.2 by the triangle to the left of the equilibrium point bounded by the vertical axis between 0 and 5 euros, the horizontal line from the 5-euro point on the vertical axis to the equilibrium

Graph 1.1
Supply–Demand Graph
Supply–Demand Graph
Graph 1.2
Supply–Demand Graph with Producer Surplus
Supply–Demand Graph with Producer Surplus
intersection of the supply and demand curve, and the supply curve to the left of the equilibrium point. The “producer surplus” triangle shows that the producers who were willing to sell for less than 5, are still getting 5 euro for their product, thus receiving a surplus (see Graph 1.2).
Consumers receive an analogous surplus. The buyer willing to pay 9 euros for her unit pays only the 5-euro equilibrium price and so gets a 4-euro surplus. The buyer willing to pay 8 receives a surplus (or bargain) of 3. And so on. The “consumer surplus” triangle shows that each buyer willing to pay more than 5 is actually paying less than she was willing to pay and thus receives a surplus. This surplus is shown in Graph 1.3 by the triangle bounded by the vertical axis above the 5-euro mark but below where the demand curve hits the vertical axis, the horizontal line at the 5-euro price level from the vertical axis to the intersection of the supply and demand curves, and the demand curve from the vertical axis to the intersection point (see Graph 1.3).
Alert readers will be wondering: What happened to the people on the right side of the intersection point? What happened to all of those sellers who thought 5 was too low a price and all of those buyers who thought 5 was too expensive? That is the subject of our next section.
A New Twist on the Basic Market Mechanism
If you have followed this reasoning thus far, you are probably dreading the next several pages. We have analyzed what happens to the buyers willing to pay the market price or higher and the sellers willing to sell at the market price or lower: in other words, those people to the left of the intersection of the supply and demand curves, who are earning a surplus. Next, we should turn to the buyers and sellers to the right of the equilibrium point and carry through even more tedious analysis on their surpluses. Well, this book does not. So savor, for a moment, the combination of perplexity and relief felt by generations of basic economics students.
Mainstream economics ignores the buyers and sellers who will not trade at the market price. Since they are not making a transaction in the market, they are not discussed. If all the world’s a stage, then in economics, only those to the left of the equilibrium price are players upon it. Those to the right of the equilibrium price are left waiting in the wings.
When we start discussing factors that make the supply and demand curves shift, the equilibrium intersection point will shift with them. Producers and consumers will shift from the right to the left of the equilibrium point and back again, from onstage to offstage and back again, with no more question about why they are offstage than actors in a play.

Graph 1.3
Supply–Demand Graph with Consumer Surplus
Supply–Demand Graph with Consumer Surplus
We suggest that the tendency of mainstream economics to ignore the producers and buyers to the right of the equilibrium point is a key reason that economists were so surprised when the transition economies experienced such huge declines in production. To see why, consider the following parable, which takes the model of supply and demand and adapts it to the real world.
Nine peasant farmers each produce the same amount of food per year, but their costs of production vary due to soil conditions. Their production costs are respectively 1 coin, 2 coins, 3 coins, and so on up to 9 coins. In the neighboring town, there are nine families that buy their food from the local peasants, and each household needs the same amount of food per year that each farmer produces. The town dwellers’ incomes vary as well. The richest can afford to pay 9 coins, the next richest 8 coins, and so forth down to the poorest town dweller who can afford to pay only 1 coin for a year’s worth of food.
The supply and demand schedules and curves will look like those in the euro example above except that we have coins instead of euros (see Graph 1.4).
The nine peasant farmers and the nine town families, having no training in economics but great respect for the wisdom of the clergy, petition the abbot of the local monastery to set up a trading mechanism for them. The abbot interviews all of the town dwellers and all of the peasants. Each town dweller tells honestly how much he is willing and able to pay for a year’s food supply. Each peasant farmer tells honestly his cost of producing a year’s worth of food.

Graph 1.4
Supply–Demand Graph
Supply–Demand Graph
When the abbot sits down to analyze the results, he is thrilled. Clearly, a divine hand is at work in his village. The producing costs of the peasant farmers exactly match the buying power of the town families. He matches up the highest cost peasant farmer to sell food to the richest town dweller for 9 coins. The next highest cost farmer is to sell to the next richest town dweller for 8 coins, and so forth all the way down to the lowest cost farmer, who sells to the poorest town dweller for only 1 coin.
When we graph this outcome on a supply demand chart, we see a very different picture than in the market example (see Graph 1.5).
Demand and supply are equal at all points. This is because the buyers and sellers are directed where and how to buy and sell, rather than choosing for themselves. The poorest consumer, able to pay only 1 coin, is now farthest to the left. The richest consumer, able to pay 9 coins, is now farthest to the right. The abbot is acting as a central planner, matching up buyers and sellers. Note that the demand line has been shifted around to meet the supply line, rather than the other way around.
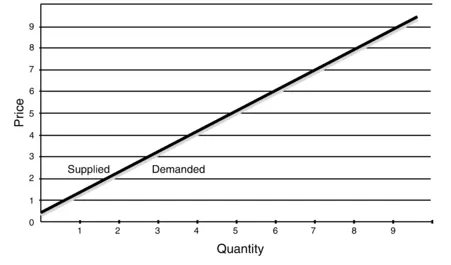
Graph 1.5
Supply–Demand Graph with Perfect Central Planning
Supply–Demand Graph with Perfect Central Planning
Note also that our centrally planned economy has greater output than the market economy did. Total output is nine annual food supplies, while in the market example it was only five. This is possible because no producer or consumer gets any surplus. Each farmer just covers costs. Each town dweller pays the maximum he can afford.
A nineteenth-century writer, who may be considered rather obscure in today’s Wall Street–dominated world, described this mechanism as “From each according to his ability (i.e.,...
Table of contents
- Cover
- Title
- Copyright
- Dedication
- Contents
- List of Tables, Graphs, Boxes
- Introduction
- 1 The Basic Market Mechanism
- 2 Firms and the Markets They Operate In
- 3 The Factors of Production
- 4 The Role of Government
- 5 Measuring Economic Activity: The Key to Understanding
- 6 Macroeconomics
- 7 Monetary Policy and Its Prerequisites
- 8 Foreign Exchange Rates and Exchange Rate Crises
- 9 Transition in the Context of the International Financial System
- 10 The Consequences for Open-Economy Macroeconomics
- 11 Benevolent and Malevolent Markets
- 12 Japan: The First Demographic Transition
- Conclusion
- Notes
- Index
- About the Authors
Frequently asked questions
Yes, you can cancel anytime from the Subscription tab in your account settings on the Perlego website. Your subscription will stay active until the end of your current billing period. Learn how to cancel your subscription
No, books cannot be downloaded as external files, such as PDFs, for use outside of Perlego. However, you can download books within the Perlego app for offline reading on mobile or tablet. Learn how to download books offline
Perlego offers two plans: Essential and Complete
- Essential is ideal for learners and professionals who enjoy exploring a wide range of subjects. Access the Essential Library with 800,000+ trusted titles and best-sellers across business, personal growth, and the humanities. Includes unlimited reading time and Standard Read Aloud voice.
- Complete: Perfect for advanced learners and researchers needing full, unrestricted access. Unlock 1.5M+ books across hundreds of subjects, including academic and specialized titles. The Complete Plan also includes advanced features like Premium Read Aloud and Research Assistant.
We are an online textbook subscription service, where you can get access to an entire online library for less than the price of a single book per month. With over 1.5 million books across 990+ topics, we’ve got you covered! Learn about our mission
Look out for the read-aloud symbol on your next book to see if you can listen to it. The read-aloud tool reads text aloud for you, highlighting the text as it is being read. You can pause it, speed it up and slow it down. Learn more about Read Aloud
Yes! You can use the Perlego app on both iOS and Android devices to read anytime, anywhere — even offline. Perfect for commutes or when you’re on the go.
Please note we cannot support devices running on iOS 13 and Android 7 or earlier. Learn more about using the app
Please note we cannot support devices running on iOS 13 and Android 7 or earlier. Learn more about using the app
Yes, you can access Economic Lessons from the Transition: The Basic Theory Re-examined by Daniel R. Kazmer,Michele Konrad in PDF and/or ePUB format, as well as other popular books in Economics & Business General. We have over 1.5 million books available in our catalogue for you to explore.