eBook - ePub
The Southern African Environment
Profiles of the SADC Countries
- 363 pages
- English
- ePUB (mobile friendly)
- Available on iOS & Android
eBook - ePub
About this book
The Southern African Environment provides a comprehensive and up-to-date description of the countries of the SADC region ? Angola, Botswana, Lesotho, Malawi, Mozambique, Namibia, Swaziland, Tanzania, Zambia and Zimbabwe. The area is one of rapid political, economic and social change, and each of the 10 country profiles in this book provides full and detailed information on the physical and human geography, environmental problems, resource base, institutional structures for environmental management and the issues associated with institutional change. Each profile was drafted by local environmental experts and is based on extensive fieldwork and research originally commissioned by the Dutch government. The report provides a unique synthesis of this richly-endowed but troubled region.
Trusted by 375,005 students
Access to over 1.5 million titles for a fair monthly price.
Study more efficiently using our study tools.
Information
1
ANGOLA
ANGOLA
INTRODUCTION
Angola is currently experiencing a thirty-year war. The war has had a catastrophic effect on the country’s economic and social infrastructure. Many Angolans have been forced into becoming refugees.
After hostilities cease it will take years for the country to re-establish its disrupted production systems and to reorganise and re-build the collapsed state health and education services. The intricate, informal social security network, through which the majority of the population were able to survive, will have to be re-created. In addition, problems in the urban areas created by the forced concentration of a large part of the population will have to be addressed.
As one can imagine, given the magnitude of problems that have to be dealt with, official institutions in Angola do not place environmental issues very high on the agenda. Environmental problems are therefore only identified by a handful of technicians, specialists and politicians. The government perceives environmental issues as being of primary concern to, and to be solved by, the rich industrialised nations. Apart from the rare occasions when new laws and regulations are announced that have some bearing on the environment, little is done. The principal aim of the Angolan government and the political parties is to achieve economic recovery. Environmental issues are of secondary importance and are still seen by many as no more than the protection of wildlife and natural habitats.
Nevertheless, what needs to be realised and accepted, is that environmental problems – such as the pollution of drinking water, sewage and waste overspill, the degradation of agricultural land in densely populated areas and the shortages of woodfuel around the cities – directly affect the lives, as well as the survival, of many Angolans.
Although Angola’s future aim is to achieve economic recovery, it is crucial for the well- being of the population that all those who make and influence decisions adjust their perception of environmental matters and come to terms with the realisation that environmental issues are not just luxury items for a privileged few.
ECONOMIC STRUCTURE
Angola has an area of 1,246,700 km2 making it the second-largest country in sub-Saharan Africa. The distance from north to south is 1277 km and from east to west is 1236 km. It is bordered by Zaire, the Congo People’s Republic, Zambia and Namibia.
The climate is tropical but locally tempered by altitude. The coast is arid or semi-arid due to the influence of the Benguela current. The area along the Namibian border experiences very high temperatures and heavy seasonal rainfall (Figure 1.1). The interior uplands have a much more pleasant climate (Figure 1.2). Angola is a sparsely populated country with a total population of 10,020,000 in 1990 (Table 1.1). Approximately 25 per cent of the population reside in urban centres. This is mainly due to the war. The high population density in the cities has created serious economic, social and environmental problems.
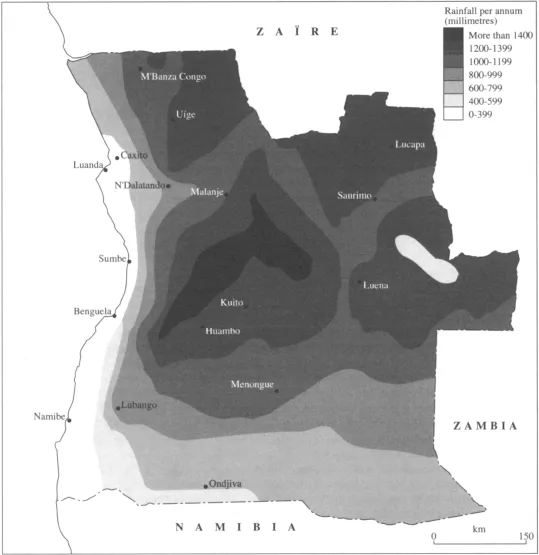
Figure 1.1 Rainfall patterns
According to Munslow (1992), conditions have not existed in the country to allow for the collection of any reliable population figures. Hence, all figures should be regarded as indicative only. Broadly, the population doubled from 2.7 million in 1900 to 5.6 million in 1970. In the latter part of this period, large-scale Portuguese immigration was a significant factor. However, the uprising and massacres of the early 1960s also promoted a population exodus to neighbouring countries as a countervailing tendency. On the eve of Independence there were 400,000 Portuguese settlers in the country, but during the transition to Independence, virtually all left. As they monopolised the skills, this left the country in a difficult situation. According to official estimates, by 1980 the population had reached 7.7 million.
Table 1.1 Principal characteristics of the population (000 inhabitants)
| Population | 1957 | 1988 | 1989 | 1990 |
| Total | 9233 | 9483 | 9739 | 0020 |
| Urban | 2933 | 3209 | 3448 | 2836 |
| Rural | 6300 | 6274 | 6291 | 7184 |
| Female | 4801 | 4931 | 5064 | 5084 |
| Male | 4432 | 4552 | 4675 | 4936 |
| According to age | ||||
| 0–14 years | 4132 | 4243 | 4357 | 4510 |
| 15– 19 years | 900 | 925 | 951 | 982 |
| 20– 29 years | 1460 | 1499 | 1539 | 1583 |
| Over 30 years | 2741 | 2816 | 2892 | 2945 |
| Per Province | ||||
| Luanda | 1302 | 1379 | 1459 | 1545 |
| Huambo | 1383 | 1418 | 1460 | 1484 |
| Bié | 1019 | 1044 | 1069 | 1093 |
| Malange | 822 | 838 | 855 | 872 |
| Huila | 803 | 818 | 834 | 860 |
| Uige | 738 | 761 | 785 | 812 |
| Other | 3167 | 3226 | 3287 | 3354 |
| provinces |
Population density is relatively low, 7.2 inhabitants per km2, but is very unevenly distributed. The south-east quarter of the country has a population of less than one person per km2, whilst the northeast quarter has a population density of between one and five persons per km2. Large parts of Huambo province have a particularly dense population concentration greater than thirty persons per km2, as do parts of Cuanza-Sul and Malanje provinces.
One of the most striking features is the very high rate of urban growth, in particular in the capital city of Luanda. The urban population is estimated to have grown at 7.6 per cent per annum over the 1980s, compared with a 0.8 per cent growth rate for the rural population. The war intensified rural-urban migration. Hence, the urban population increased from 23 per cent to 37 per cent of the total population between 1980 and 1990. Luanda accounted for 1.2 million of the urban population by 1986, or 44 per cent of the total urban population. By 1990, Luanda’s estimated population had reached 1.5 million, some 54 per cent of the total urban population.
There are three major factors which have adversely affected economic growth since independence in 1974:
• the war effort which consumes not only a considerable part of the national budget but also a large part of the country’s qualified manpower;
• the exit of thousands of Portuguese after the declaration of Independence, in some cases destroying economic property and leaving the country without qualified personnel to manage the economy and government services;
• the government’s economic policy which, influenced by a state of permanent war and the lack of personnel, aimed at directing the economy by quantitative, centralised planning.
These three factors have resulted in a slow – and sometimes negative – growth of the national economy. The following table shows the rate of change of GDP for the period 1985–1989.
Table 1.2 Change of GDP by economic sector, 1985–1989 (at 1980 prices and factor costs)
| Sector | Annual growth rate (%) |
| Petrol products | +19.3 |
| Diamonds | +16.8 |
| Electricity | +5.0 |
| Commerce | +0.3 |
| Services | −0.2 |
| Transport and | −0.1 |
| communications | |
| Agriculture, silviculture | −3.6 |
| and fishing | |
| Construction | −5.3 |
| Transforming industries | −6.1 |
| Total GDP | +8.5 |
The following table shows that the growth of the national economy over the period 1970–1989 was almost entirely dependent on the growth of output in the petroleum and diamond sectors.
Table 1.3 Changes to the structure of the GDP, 1970–1989
| Sector | Structure of GDP (%) | |||
| 1970 1 | 1987 2 | 1989 2 | ||
Petroleum products | 7.7 | 41.1 | 60.2 | |
Services | 12.1 3 | 19.1 | 13.4 | |
Agriculture, silviculture and fisheries | 17.1 4 | 18.5 | 11.5 | |
Commerce | 31.8 | 6.7 | 4.7 | |
Construction | 5.7 5 | 4.5 | 2.6 | |
Transforming industries | 11.1 | 4.3 | 2.6 | |
Transport and communication | 6.2 | 3.8 | 2.7 | |
Diamonds | 7.5 | 1.6 | 2.1 | |
Electricity | 0.9 | 0.3 | 0.2 | |
Notes
1 adapted from Dilolwa (1978) and not including other extractive industries, banking, securities and transactions, housing, public administration and household work
2 at constant 1980 prices and factor costs
3 including ‘non defined’ activities and public services
4 including production for direct consumption in the household...
Table of contents
- Cover
- Half Title
- Title Page
- Copyright Page
- Table of Contents
- List of Figures
- List of Tables
- Glossary
- Foreword
- Acknowledgements
- Introduction: Sustainable development and the SADC environment
- 1 Angola
- 2 Botswana
- 3 Lesotho
- 4 Malawi
- 5 Mozambique
- 6 Namibia
- 7 Swaziland
- 8 Tanzania
- 9 Zambia
- 10 Zimbabwe
- Index
Frequently asked questions
Yes, you can cancel anytime from the Subscription tab in your account settings on the Perlego website. Your subscription will stay active until the end of your current billing period. Learn how to cancel your subscription
No, books cannot be downloaded as external files, such as PDFs, for use outside of Perlego. However, you can download books within the Perlego app for offline reading on mobile or tablet. Learn how to download books offline
Perlego offers two plans: Essential and Complete
- Essential is ideal for learners and professionals who enjoy exploring a wide range of subjects. Access the Essential Library with 800,000+ trusted titles and best-sellers across business, personal growth, and the humanities. Includes unlimited reading time and Standard Read Aloud voice.
- Complete: Perfect for advanced learners and researchers needing full, unrestricted access. Unlock 1.5M+ books across hundreds of subjects, including academic and specialized titles. The Complete Plan also includes advanced features like Premium Read Aloud and Research Assistant.
We are an online textbook subscription service, where you can get access to an entire online library for less than the price of a single book per month. With over 1.5 million books across 990+ topics, we’ve got you covered! Learn about our mission
Look out for the read-aloud symbol on your next book to see if you can listen to it. The read-aloud tool reads text aloud for you, highlighting the text as it is being read. You can pause it, speed it up and slow it down. Learn more about Read Aloud
Yes! You can use the Perlego app on both iOS and Android devices to read anytime, anywhere — even offline. Perfect for commutes or when you’re on the go.
Please note we cannot support devices running on iOS 13 and Android 7 or earlier. Learn more about using the app
Please note we cannot support devices running on iOS 13 and Android 7 or earlier. Learn more about using the app
Yes, you can access The Southern African Environment by Sam Moyo,Michael Sill, Phil O'Keefe in PDF and/or ePUB format, as well as other popular books in Economics & Development Economics. We have over 1.5 million books available in our catalogue for you to explore.