- 137 pages
- English
- ePUB (mobile friendly)
- Available on iOS & Android
eBook - ePub
Pricing and Performance of Initial Public Offerings in the United States
About this book
In this timely volume on newly emerging financial mar- kets and investment strategies, Arvin Ghosh explores the intriguing topic of initial public offerings (IPOs) of securities, among the most significant phenomena in the United States stock markets in recent years. Before the 2000-2001 market turndown, hardly a week went by when more than a few companies did not become public, either in the organized stock exchange or in the Over the Counter (OTC) market. In the often over-burdened, technology-heavy Nasdaq market, the role of IPOs was crucial for the market's new vigor and growth. Internet stocks were able to find a mode to supply key momentum to the market. In the so-called "New Economy" of the 1990s, it was the seductively accessible IPO that ushered in the world's information technology revolution.Ghosh sets out to examine the pricing and financial performance of IPOs in the United States during the period 1990-2001. In the opening chapter he discusses the rise and fall of IPOs in the preceding decade. Chapter 2 further delineates the IPO process from the start of the prospectus to the end of the "quiet period" and aftermarket stabilization. In chapter 3 Ghosh analyzes the mispricing and deliberately deceptive underpricing, or "flipping," of Internet IPOs. Chapter 4 delves deeper into the pricing and operating efficiency of Nasdaq IPOs. Chapter 5 analyzes the pricing and long-run performance of IPOs both in the New York Stock Exchange and in the Nasdaq markets. In chapters 6 and 7 the author deals with the pricing and performance of the venture-blocked and nonventure-backed IPOs in general and Internet IPOs in particular. In chapter 8 he analyzes the role of underwriters as market makers. In chapter 9 Ghosh discusses the accuracy of analysts' earnings forecasts. In the concluding chapter, he summarizes the principal findings of the study and the recent revival of the IPO market and its place in capital formation as well as the latest developments in t
Trusted by 375,005 students
Access to over 1.5 million titles for a fair monthly price.
Study more efficiently using our study tools.
Information
1
Introduction The IPO Phenomenon in the 1990s
Initial Public Offerings (IPOs) were the most prevalent form of security issues by firms wanting to raise capital in the United States during 1990-2000. The IPO phenomenon got a tremendous boost in the late 1990s by the popularity of Internet stocks. When Yahoo!, an online search engine, went public in March 1996, the investing public went agog with excitement, particularly the online traders, a new breed of individual investors. In the so-called ‘bubble period’ of 1998-1999, hardly a week went by when one or two IPOs, particularly Internet IPOs, did not appear in the capital market. In 1998, five IPOs had over 200 percent first-day returns, while in 1999, forty-eight IPOs had that distinction, with eight having returns of more than 400 percent on the first day. Also in 1999, 117 IPOs doubled their prices on the first day trading alone. It was quite possible that without the IPOs, the stock market boom of the 1990s would not have been sustained for such a long time and with such vigor as to push U.S. stock prices to historical highs. In the bull market of 1990s, it was the IPOs that created the climate of ‘irrational exuberance,’ particularly in the technology-heavy NASDAQ market.1
From its humble beginning in 1884 when Eastman Kodak went public with fourteen shareholders, the IPO market exploded during the last decade of the twentieth century when more than 4000 IPOs were issued in the United States and traded on organized exchanges and the over-the-counter market. Tens of millions of dollars were raised every month by companies offering stock to the public for the first time. According to Professor Jay Ritter, in the 1980s the average price of IPOs increased from the offer price to the first-day closing price by only 7 percent. However, the average first-day return tripled to 21 percent in the 1990s.2 In the 1990s, institutional and individual investors alike were mesmerized by the huge profit potential in the IPO market. In the 1990s, the IPO market was “like the opening of the American West over 150 years ago—the transcontinental railroad, the Gold Rush and the availability of land made the opportunities seem limitless,” to quote Linda Killian, et al., from their popular book, IPOs for Everyone.3
Unfortunately, with the stock market taking a sharp downturn after March 2000, many of these firms have succumbed to the market pressure and have gone out of business. But many well-established companies in the United States also entered the IPO market, most are still in business and a number of them are, in fact, thriving. Although the NASDAQ stock market had the largest number of IPO listings, the New York Stock Exchange (NYSE) also listed a significant number of IPOs. By studying the IPOs in these two markets, will we be able to understand the dynamics of the stock markets that shaped and molded the United States economy in the most fundamental way.
The IPOs During 1990-1995
The IPOs did not burst onto the scene, of course, in 1990. They had a long and checkered history before evolving into an effective tool for raising capital for companies wanting to go public. In their extensive database of 4,753 IPOs during 1970-1990, Professors Loughran and Ritter listed 876 IPOs during 1970-72, 634 IPOs during 1980-1982, and 1,315 IPOs during 1983-1985 in the United States alone.4 Even before 1970, there were quite a few IPOs in the United States, as Linda Killian, et al., mentioned in their book. When we examine the data base maintained by the Securities Data Company (SDC), now owned by Thomson Financial, we find that during 1970-1972, the IPO market was quite strong, with an average of slightly over 300 IPOs per year, with an average offer price of about $9, and raising an average of over $3 million per issuance. But with the onset of the recessionary period in 1973, the IPO numbers started to dwindle. In the worst “stagflation” years of 1974-1975, IPOs were less than double digit in number, although the average offer price during 1973-1975 was higher than during the previous period. Nevertheless, the IPO market was up again after 1978 when the average number of IPOs per year was 378 during 1978-1985, the average offer price was $7, and the average amount of money raised was $9.59 million per issuance.5
The IPO business, however, had picked up in 1986-1987 before the stock market crash of 1987, when a record 533 IPO issues raised $24 billion in capital. Even in 1988, 255 IPOs raised $22.4 billion for the issuing firms. But 1989 was the slowest year in the six-year period (1983-1989) when 245 IPOs came into market raising $19.2 billion, down 55 percent from the peak in 1986. Also, new offerings from closed-end funds were scarcer in 1989. For the first time in those years, these investment companies that were listed on stock exchanges or the O-T-C market, did not have a dominant part in the IPO market. These funds issued only about $7 billion worth of new shares or slightly more than 50 percent of the total IPO volume. In the past, closed-end fund IPOs had accounted for 75 percent or more of the total capital raised.
The initial public offerings market fared even worse in 1990, mainly because of Iraq’s occupation of Kuwait in August of that year and the impending threat of the Gulf War to be launched by the United States. Dollar volume of IPOs in 1990 slumped from 1989’s already paltry level, to $10.2 billion. In 1990’s fourth quarter, just fifty-nine IPOs were issued—the lowest quarterly total in more than ten years. And the $3 billion raised in the fourth quarter was the lowest in six years. The White House admitted that the United States economy was in recession, and predicted that the downturn would last until the coming summer. But the stock market ended its worst year since 1981, when the DJIA climbed to 2,633 on December 31, 1990. After a slow start in January 1991 with four deals, there were seven in February, eighteen in March, and twenty-eight in April. From then on the IPO market did not slow down again until September 1998. As a matter of fact, investment bankers sold $16.4 billion in shares from 360 IPOs, just behind the 1986 record of $18.3 billion. An additional 454 already-public companies sold over $29 billion more in new shares, making 1991 a record year for seasoned equity offerings, according to IDD Information Services, Inc. Leverage buyouts, which were the craze in the 1980s, almost died out as the 1990s dawned.
But 1992 turned out to be a banner year for the IPO market, as 595 were issued and $39.4 billion were raised from investors. The number soared to 170 in the first quarter, and after a summer slump, rebounded in the fourth quarter with 159 offerings. Biotechnology stocks dominated the new-issue market during the early part of the year, and finished strongly with technology-related issues. Fueling the IPO boom in that year was a bull market in small stocks, and as a result, the NASDAQ composite index rose to 676.95, closing the year with a 15.5 percent gain. Among the IPOs, Lone Star Steakhouse was a big winner with a 457 percent increase over its offer price, followed by Casino Magic with a 360 percent rise from its offer price by the end of the year. Starbucks went public in June of that year, with an offer price of $21.50 and finishing at $37 at the end of 1992.
Nineteen ninety three was also a very good year for the IPO stocks. More than 800 companies came to the equity market for the first time, with the volume totaling $57 billion, higher than the 1990’s record of $40 billion. The IPOs’ gain averaged 21 percent for the year. The biggest IPO issue that year was from a foreign company— a $2.7 billion offering of YPF Sociedad Anonima, Argentine’s state-owned oil company. Next came a $2.1 billion offering from Allstate Corporation. Two trends were established in the underwriting business in that year: first, stock was preferred over bonds as a capital-raising vehicle, and second, strong IPO offerings came from Latin America, the Far East and Europe and listed in the United States stock markets. In 1994, the stock market had a lackluster performance when the Dow Jones Industrial Average (DJIA) rose by 2.14 percent to 3834.44, the NASDAQ lost 3.14 percent to 751.96, and the Russell 2000, the small-capitalization stock index, also lost 3.18 percent in that year. The largest IPO issuer in that year was TeleDenmark ($2,975 million) with an annual gain of 8.4 percent, but the second largest issuer—Istituto Nazionale Assicun, with a $2,866.6 million offering lost 15.6 percent for the whole year. OfficeMax gained 39.5 percent—the highest gain in that year among the IPOs, while Playtex Products lost 45.2 percent—the largest loss among the IPOs in that year.
In 1995, the fourth quarter was the strongest for the IPO market, with technology companies being hot that year. Internet companies supplying tools and applications for managing the World Wide Web started to appear for the first time. Open.Text, that provided search software for LANs, WANs and the Internet, went public with 3.6 million shares. Branded consumer names such as Gucci, Estee Lauder and Oakley launched successful IPOs, with Gucci up by 76 percent, Estee Lauder up by 34 percent, and Oakley gained 48 percent in share price by the end of that year. The IPO after-market was strong and showed no sign of weakening. Companies selling everything from jeans to bagels to flowers went public.
The IPOs in 1996-1999
The year 1996 was a watershed year for the United States IPOs. In February through early June of that year, there was a buying frenzy by institutions and individuals alike for any kind of high-technology or Internet IPOs, irrespective of their profit potentials—a forerunner of the event we witnessed again in 1999. Awash with 401 (K) funds, fund managers of the aggressive-growth mutual funds and microcap funds were the biggest buyers of IPOs. There were many IPOs whose first-day gains were over 50 percent of the offer price. Then came the summer when the IPO market cooled off considerably with many of the stocks losing more than 30 percent of their value. The last quarter of the year saw a new spurt in the IPO market that continued beyond 1996. In all, 872 IPOs were issued in that year raising $49.9 billion—the most ever from the IPO market. Business software, mortgage finance and telecommunications services were the strongest sectors in that year. Also, during the two years of 1995-1996, the average IPO gained nearly 30 percent on its first day of issuance—a remarkable feat indeed.
Even with their high initial prices, IPOs on average turned up below-market returns of 12.1 percent in 1996. This was much below 1995’s average return of 33.9 percent and below 1996’s DJIA return of 26 percent. In Table 1 we have provided the top ten and worst ten IPO performers for 1996. Here we find that Cyner Corp had an annual gain of 406 percent, followed by Outdoor Systems with an annual return of 321 percent. The worst performance was that of Cable & Co. Worldwide, with a negative annual return of 85 percent, followed by N-Vision Company, with a negative 83 percent annual return. The biggest story that year was the spin-off of AT&T Corporation’s telecommunication units named Lucent Technologies, Inc. That year Yahoo went public in April at a $13 offer price and quickly shot up to $30, despite its question of future profitability. It was also the year of the largest foreign IPO issuance in the United States when Goldman, Sachs & Co. brought Deutsche Telecom AG, the German telecommunications company into the public domain.
Nineteen ninety-seven also was a very good year for the IPO market, but not as robust as 1996 because of a small downturn in October 1997 (“The October Effect”). In 1997, 629 IPOs raised over $39 billion, according to CommScan, Inc., a New York securities research company.6 The year’s offering, on average, returned just over 19 percent, calculated annually, as compared with the DJIA of 22.6 percent, and 20.5 percent for the small stock Russell 2000 index. Those who bought after the first day gained on average of 7.2 percent annual return. The biggest deals that year were the $438 million offering of car rental company Hertz Corp., the $611 million offering of Polo Ralph Lauren, and the $798 million offering of the oil drilling company Santa Fe International, a unit of Kuwait Petroleum. Also debuting that year were the online book-selling company Amazon.com with an offer price of $18 a share which rose nearly 70 percent in first-day trading, and the semiconductor maker Rambus which was offered at $12 a share and doubled in price at the end of first-day trading.
Table 1.1
Top 10 and Worst 10 Performance of the IPOs in 1996
Top 10 and Worst 10 Performance of the IPOs in 1996
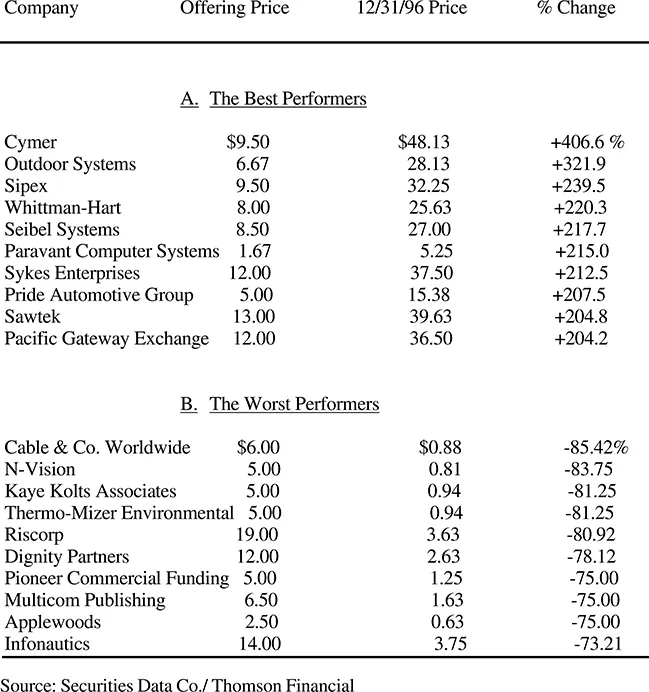
Source: Securities Data Co./ Thomson Financial
But 1998 was a lackluster year for the IPO market. There were only 373 IPOs that came to the market, down about 40 percent in number from 1997. In terms of total dollar volume, newly-issued companies raised slightly more than $36.5 billion, down 10 percent from the 1997 total, and down 29 percent from the 1996 total. Also, IPOs rose on average by less than 9 percent from their opening prices, while the S & P 500 stock index rose by 31 percent. But some of the biggest IPOs took place that year when Du Pont Co. sold its subsidiary Conoco, Inc. in the IPO market. Investors paid $44 billion for that company. They also paid $5.6 billion for the Swiss telecom concern Swisscom AG, and $18 billion for the offering of NTT Mobile Communications Network, Inc., a former subsidiary of the Japanese mobile telecommunications company NTT DoCoMo. Also in that year online auctioneer eBay Inc. went public, surging sixteen-fold from its September offering price of $18 to a high of $301. At its peak, eBay had the same market capitalization of Federated Department Stores, Inc., and half the market value of Sears, Roebuck & Co., the venerated department store chain in America.
The year 1999 was The Year of the IPOs, particularly for Internet IPOs. The surge in the IPO market witnessed in late 1998 carried through all of 1999 and dried up only in March 2000 when the stock market in general, and the IPO market in particular, went sour. Newly-issued public companies in that year were 544 in number, up from 373 in 1998, but less than the record set in 1996 of 872 companies coming to the public stock markets for the first time. The IPOs in 1999 raised $69.1 billion, which was nearly double the 1998 total of $36.5 billion, and close to 40 percent higher than the previous record of $49.9 billion in 1996, according to the Securities Data Company of Thomson Financial. These numbers included both large and small capitalization companies, but excluded closed-end mutual funds and real estate investment trusts. As of June 1999, IPOs soared an average 43 percent from their opening price, compared to 8.5 percent gain of the S&P 500 stock index.
Many large and small companies went public that year, with Web-based and technology start-ups being the most prominent. The biggest IPO in the U.S. history occurred that year when UPS, in early November, raised $4.38 billion. Goldman, Sachs & Co. raised $2.72 billion in the U.S. when it went public in May for the first time. But price-performance-wise, it was the software company VA Software Systems, Inc. which ruled the roost when its shares soared 697.50 percent on the first day of trading on December 9, heading the list of all-time first-day IPO price increases. MarketWatch.Com Inc. jumped 474 percent in its first day t...
Table of contents
- Cover Page
- Half title
- Title Page
- Copyright Page
- Dedication
- Contents
- List of Tables
- Preface
- 1 Introduction The IPO Phenomenon in the 1990s
- 2 The IPO Process
- 3 The Mispricing and Flipping of the Internet IPOS
- 4 Post-Issue Operating Performance of NASDAQ IPOs
- 5 Pricing and Performance of the United States IPOs
- 6 Pricing and Long-Run Performance of Venture-Backed and Nonventure-Backed IPO
- 7 Pricing and Operating Efficiency of Venture-Backed and Nonventure-Backed Internet IPOs
- 8 Gross Spread of the Underwriters and Offer Price of the IPOs, 1990-2000
- 9 Accuracy of Analysts’ IPO Earnings Forecasts
- 10 Summary and Conclusions
- Bibliography
- Index
Frequently asked questions
Yes, you can cancel anytime from the Subscription tab in your account settings on the Perlego website. Your subscription will stay active until the end of your current billing period. Learn how to cancel your subscription
No, books cannot be downloaded as external files, such as PDFs, for use outside of Perlego. However, you can download books within the Perlego app for offline reading on mobile or tablet. Learn how to download books offline
Perlego offers two plans: Essential and Complete
- Essential is ideal for learners and professionals who enjoy exploring a wide range of subjects. Access the Essential Library with 800,000+ trusted titles and best-sellers across business, personal growth, and the humanities. Includes unlimited reading time and Standard Read Aloud voice.
- Complete: Perfect for advanced learners and researchers needing full, unrestricted access. Unlock 1.5M+ books across hundreds of subjects, including academic and specialized titles. The Complete Plan also includes advanced features like Premium Read Aloud and Research Assistant.
We are an online textbook subscription service, where you can get access to an entire online library for less than the price of a single book per month. With over 1.5 million books across 990+ topics, we’ve got you covered! Learn about our mission
Look out for the read-aloud symbol on your next book to see if you can listen to it. The read-aloud tool reads text aloud for you, highlighting the text as it is being read. You can pause it, speed it up and slow it down. Learn more about Read Aloud
Yes! You can use the Perlego app on both iOS and Android devices to read anytime, anywhere — even offline. Perfect for commutes or when you’re on the go.
Please note we cannot support devices running on iOS 13 and Android 7 or earlier. Learn more about using the app
Please note we cannot support devices running on iOS 13 and Android 7 or earlier. Learn more about using the app
Yes, you can access Pricing and Performance of Initial Public Offerings in the United States by Arvin Ghosh in PDF and/or ePUB format, as well as other popular books in Business & Business General. We have over 1.5 million books available in our catalogue for you to explore.