![]()
Global
Perspectives
KEY FACTS
• Average global per capita income has now passed US$5 000 a year - 2.6 times that of 1950 - but more than 1 300 million people still live on less than US$1 per day.
• The high-income countries, home to 20 per cent of the world’s population, account for about 60 per cent of commercial energy use.
• Total carbon emissions from China now exceed those of the European Union although China’s per capita emissions are much lower.
• World military expenditure fell by an average of 4.5 per cent a year during the decade 1988-97.
• In 1996, private investment, concentrated in a limited number of developing countries, was about US$250 000 million, compared to overseas development assistance of less than US$50 000 million.
• A tenfold reduction in resource consumption in the industrialized countries is a necessary long-term target if adequate resources are to be released for the needs of developing countries.
• There are encouraging signs of real interest among consumers in more environmentally-sustainable products and services. A number of cooperative organizations have sprung up to promote the ‘Fair Trade’ movement, which aims to achieve fair prices for small farmers who use environmentaIiy-friendly methods. Such products are beginning to move from niche markets to the mainstream.
• The processes of globalization that are so strongly influencing the evolution of society need to be directed towards resolving rather than aggravating the serious imbalances that divide the world today.
The last millennium change on this planet took place under very different conditions from those found today. In China, the Sung dynasty, with its giant metropolitan centres, delicate paintings and moving poetry, had by the year ad 1000 been established for 40 years. Islamic culture had welded disparate peoples over an area stretching from Spain to central Asia and northern India into a single cultural unit. In Mexico, the lowland Mayan civilization had collapsed and the Toltecs were building the first great Meso-American civilization. In Africa, Arab culture flourished in the north, the kingdoms of Kanem and Ghana, with their substantial stone-built houses, held sway in the west, and in the east the influence of the Ethiopian empire was waning. In Europe, the Cluny Abbey had just been rebuilt for the first time. Waterpower was being more effectively harnessed than in Roman times and innovative credit instruments were being developed. After centuries of exporting unskilled labour and raw material, the region was now becoming an exporter of industrial products - while importing chemicals for cloth manufacture in the cities of northern Italy and Flanders (Gies 1994, Lacey and Danziger 1999).
One thousand years later, the planet is also poised on the threshold of a new era - one in which the disparate divisions that have always separated human beings in one area from those in another are finally disappearing. Globalization and electronic communications are effecting a profound revolution. The Industrial Revolution of the 19th century is being replaced by the Communications Revolution.
This chapter provides a background perspective to the environmental changes covered in the rest of the report. It describes the main drivers of environmental change - the economy, population growth, political organization, conflict, peace and security, and regionalization. It then assesses the main dangers and opportunities presented by the beginning of the third millennium; globalization, trade, International debt, demography, the consumer culture, technology and transport. Finally, It examines responses to the situation, covering environmental policies, the changing concept of development, science and research, business and industry, employment and consumer awareness.
Social and economic background
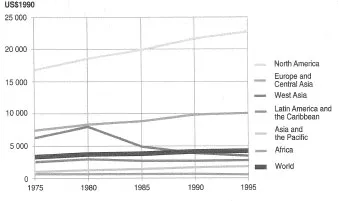
Since 1950, the global economy has more than quintupled In size. Despite the financial turmoil in East Asia starting in late 1997, the world’s economy continues to expand, growing by 4.1 per cent in 1997. In terms of income, the global per capita average has now passed US$5 000 a year - 2.8 times that of 1950 (in real terms).
Average figures for income hide great discrepancies between regions (see graph), between countries, and between population groups within countries. Despite remarkable improvements in many places, one-quarter of the world’s population remains in severe poverty. In 1993, more than 1300 million people were living on less than US$1 per day. Of these, the largest number, nearly 1000 million people, are in the Asia and Pacific region: the highest proportion and the fastest growth are In sub-Saharan Africa, where half the population is expected to be poor by 2000; a growing number, 110 million in 1993, are in Latin America; the number below the poverty level in Eastern Europe and the former Soviet Union had risen to 120 million people by 1993/94; and, in industrialized countries, 80 million people are still below the poverty line (UNDP 1997).
Nearly half of all people now live in cities; an increasing number of them travel enormous distances every year by private car and in aircraft. In the developed world, technology has transformed patterns of work and family life, communications, leisure activities, diet and health. Similar transformations are well under way in the more prosperous parts of the developing world.
GDP per capita
Source: compiled by RIVM, the Netherlands, from World Bank and UN data
The impacts of these changes on the natural environment are complex. The modern industrial economies of North America, Europe and parts of East Asia consume immense quantities of energy and raw materials, and produce high volumes of wastes and polluting emissions. The magnitude of this economic activity is causing environmental damage on a global scale (notably climate change) and widespread pollution and disruption of ecosystems, often in countries far removed from the site of consumption. Considerable progress has been made in controlling pollution at local and transboundary levels in the wealthier industrialized countries but the wider-scale impacts (apart from ozone depletion) have yet to be tackled effectively.
Steady growth in global GDP/capita hides large differences both between regions
In other regions, particularly in many parts of the developing world, poverty combined with rapid population growth is leading to widespread degradation of renewable resources - primarily forests, soils and water. People living in subsistence economies are faced with few alternatives to depleting their natural resources. Renewable resources still sustain the livelihood of nearly one-third of the world’s population; environmental deterioration therefore directly reduces living standards and prospects for economic improvement among rural peoples. At the same time, rapid urbanization and Industrialization in many developing countries are creating high levels of air and water pollution, which often hit the poor hardest. Worldwide, the urban poor tend to live in neglected neighbourhoods, enduring pollution, waste dumping and 111 health, but lacking the political influence to effect improvements. Consumption and waste generation among the newly industrialized nations are rising very steeply - approaching, and in some cases even overtaking, per capita consumption levels in industrialized countries. In 1995, per capita energy consumption In the Republic of Korea, for example, equalled that of Italy (UNSTAT 1997). The same is true of many consumers in prosperous enclaves of the developing countries and those in economies in transition.
Annual average growth of per capita GDP (1975-95)
Africa |
-0.2% |
| Asia and the Pacific | 3.09% |
| Europe and Central Asia | 1.54% |
| Latin America and the Caribbean | 0.66% |
| North America | 1.53% |
| West Asia | -2.93% |
| WORLD | 1.17% |
Source: compiled by RIVM, the Netherlands, from World Bank and UN data
So what does the future hold in store? GEO-1 included an account of a ‘business-as-usual’ scenario in which the world population nearly doubled between 1990 and 2050, and GDP per capita, expressed in constant prices, grew 2.4 times. Simultaneously, food requirements doubled, energy consumption rose by a factor of 2.6 and water consumption by a factor of nearly 1.5. The world economy continued its rapid growth with a projected rise In GDP of 4.5 times. Under this scenario, sufficient food would be available globally to feed all the growing population but Inequalities of access would mean that hunger would remain.
From what follows in GEO-2000, it Is clear that If present trends In population growth, economic growth and consumption patterns were continued, the natural environment would be Increasingly stressed. Distinct environmental gains and Improvements would probably be offset by the pace and scale of global economic growth, Increased global environmental pollution and accelerated degradation of the Earth’s renewable resource base.
The negative Impacts of environmental degradation would fall most heavily (as they do now) on the poorer developing regions. The income gap between rich and poor countries, and between the rich and poor within countries, would Increase for several decades. The ratio of income between the richest and poorest 20 per cent of the world population doubled from 30:1 to more than 80:1 between 1960 and 1995 (UNDP 1998). Under a business-as-usual scenario, current inequities In the distribution of the environmental costs and benefits of consumption seem likely to grow worse. This could be expected to have a destabilizing influence on the physical, social and political environment.
However, trends towards environmental degradation can be slowed, and economic activity can be shifted to a more sustainable pattern. Choices for development, and levels and patterns of consumption, are shaped by human aspirations and values, and these choices can be Influenced by policy Intervention. Many promising policy responses are being developed and tested, as described in this report.
Some environmental trends over the past half- century demonstrate the potential of regulation, Information and, above all, prices to encourage both more efficient and less polluting uses of energy and materials. Technology has already delivered astonishing improvements in product performance but Innovation to improve resource productivity - the utility that can be squeezed out of any given amount of resource Input - has so far lagged behind. Better public understanding and awareness of the environmental and social consequences of the consumer society have begun to catalyse profound shifts in purchasing behaviour and lifestyle choices. The challenge for policy-makers In the next century will be to devise approaches that encourage a more efficient, fair and responsible use of natural resources by the production sectors of the economy, that encourage consumers to support and demand such changes, and that will lead to a more equitable use of resources by the entire world population. In this context, policy-makers are not necessarily government officials. Business leaders also make policy, and in some of the major industrialized countries business leaders are already leading the way to improved systems of resource use (Rabobank 1998).
The key drivers
The forces that are driving global change are a complex mix of economic and political factors magnified by a high rate of population growth. These interact in ways that are not always predictable. While it is possible to identify overall trends in each of these factors, we are often less successful in identifying feedback loops and interrelationships between them that may be critical to the ultimate outcome. In this report, many trends are described and projections made, each of which is based on sound reasoning. However, we are still far from being able to understand, model and forecast all the complex Interactions in the global human and natural system. Just as engineers allow for a considerable margin of safety, so we should not rely only on the most optimistic assumptions in each sector as the basis for decisions on our future well-being and survival
Economy
The industrialized countries still dominate economic activity; absolute and per capita levels of consumption of most - if not all - natural resources remain far higher in the OECD economies than in the developing countries. A recent, detailed study of four industrialized countries Indicates that the total quantity of natural resources, or materials flow, required to support their economies ranges from 45 to 85 tonnes per person per year. A significant proportion of those resources is imported from developing countries (Adriaanse and others 1997). In 1995, the high-income countries, home to 20 per cent of the world’s population, accounted for about 60 per cent of commercial energy use (UNSTAT 1997). The bar chart above right shows total and per capita energy consumption by region.
The United States, Japan and the European Union produce more than 40 per cent of global carbon dioxide emissions (CDIAC 1998). However, there have been unprecedented rates of economic growth In many developing countries, particularly the populous economies of east and south Asia, over the past 25 years. The highest consumption growth rates are now found In the developing world and, because of the large populations in these regions, their total consumption is catching up with the Industrialized world. Total carbon emissions from China now exceed those of the European Union, although China’s per capita emissions are much lower (CDIAC 1998).
The pattern of industrial activity has undergone important shifts In recent decades. Heavy Industry is expanding rapidly in the developing Aslan and South American economies, while expansion of the industrial base In Europe, the United States and Japan is directed more to high technology production processes and service-oriented activities.
These structural shifts, together with reduced material Intensity and improved cleaner-production practices, have contributed to an overall slowdown in industry-related...