![]()
1 Introduction
It has been seven years between editions. The Real Cost of Cheap Food first appeared in 2011, on the heels of the Great Recession and during a time of near-record food prices according to the FAO’s (Food and Agriculture Organization) food price index (see Table 1.1). This was also a period of record gas prices. Shortly before its publication, the famed food journalist and frequent New York Times contributor, Mark Bittman (2010), declared, “The era of cheap, abundant food is over.” Two days later, the venerable magazine The Atlantic published an article titled “The End of Cheap Food?” (Fromson 2010). Headlines like this led a colleague to ask, just before the first edition came out, if the book was published ten years too late?
Hindsight is 20/20. In the years since the first edition, the issues covered in The Real Cost of Cheap Food have not gone away. If anything, they have become more pertinent as globalization and neoliberalism have strengthened the hand of transnational agribusiness.
What do I mean by cheap food? And why am I against it?
To begin, cheap food means exactly what you would think it might—rock-bottom retail-priced food. I can hear proponents of cheap food now: “What’s wrong with that? Cheap food, in this sense, enhances wellbeing!”
Does it?
I have actually done considerable research on the subject of the relationships between conventional (cheap) food policy and prosperity (Carolan 2013). The findings do not fit the narratives we are being fed on the subject. Here is a taste of what I discovered—you’ll have to read beyond this chapter if you want the full meal.
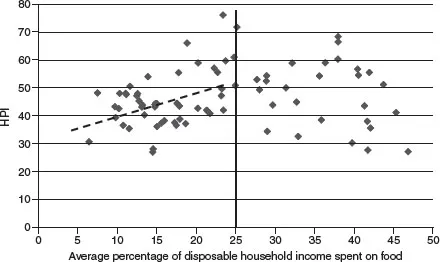
The Happy Planet Index (HPI) is a prosperity metric that takes into consideration a country’s life expectancy at birth, general life satisfaction score, and ecological footprint. A high HPI score thus reflects a country with high life expectancy, high life satisfaction, and low ecological footprint. Figure 1.1 plots the relationship between HPI and average percentage of disposable household income spent on food (see Box 1.1). We are told that countries whose citizens spend the smallest share of their incomes on food also have the highest levels of prosperity, which I would expect to mean that they would have envious HPI scores. In fact, countries with the cheapest food report some of the lowest HPI numbers. There’s nothing to be envious of in that.
Table 1.1 FAO Food Price Index, 1961–2016
| Year | Nominal Price Index (non adjusted) | Real Price Index (adjusted for inflation) |
| (2002–2004 = 100) | |
| 1961 | 33.2 | 131.7 |
| 1962 | 32.8 | 128.0 |
| 1963 | 34.6 | 137.4 |
| 1964 | 36.3 | 142.2 |
| 1965 | 36.5 | 141.5 |
| 1966 | 37.0 | 138.2 |
| 1967 | 36.6 | 135.7 |
| 1968 | 35.0 | 130.8 |
| 1969 | 36.6 | 129.9 |
| 1970 | 38.4 | 128.3 |
| 1971 | 41.0 | 130.1 |
| 1972 | 44.3 | 128.8 |
| 1973 | 60.0 | 150.5 |
| 1974 | 86.2 | 177.4 |
| 1975 | 92.0 | 170.5 |
| 1976 | 79.5 | 145.5 |
| 1977 | 79.0 | 133.9 |
| 1978 | 87.9 | 128.2 |
| 1979 | 98.0 | 128.1 |
| 1980 | 109.1 | 129.7 |
| 1981 | 106.6 | 126.5 |
| 1982 | 93.8 | 114.8 |
| 1983 | 89.1 | 111.9 |
| 1984 | 91.9 | 118.1 |
| 1985 | 83.1 | 107.8 |
| 1986 | 82.4 | 93.0 |
| 1987 | 85.0 | 87.6 |
| 1988 | 95.9 | 92.8 |
| 1989 | 101.1 | 98.4 |
| 1990 | 107.2 | 100.4 |
| 1991 | 105.0 | 98.7 |
| 1992 | 109.2 | 101.1 |
| 1993 | 105.5 | 97.1 |
| 1994 | 110.3 | 101.3 |
| 1995 | 125.3 | 105.3 |
| 1996 | 131.1 | 113.7 |
| 1997 | 120.3 | 111.3 |
| 1998 | 108.6 | 105.6 |
| 1999 | 93.2 | 92.6 |
| 2000 | 91.1 | 92.4 |
| 2001 | 94.6 | 101.0 |
| 2002 | 89.6 | 96.2 |
| 2003 | 97.7 | 98.1 |
| 2004 | 112.7 | 105.0 |
| 2005 | 118.0 | 106.8 |
| 2006 | 127.2 | 112.7 |
| 2007 | 161.4 | 134.6 |
| 2008 | 201.4 | 155.7 |
| 2009 | 160.3 | 132.8 |
| 2010 | 188.0 | 150.7 |
| 2011 | 229.9 | 169.1 |
| 2012 | 213.3 | 158.8 |
| 2013 | 209.8 | 158.5 |
| 2014 | 201.8 | 152.0 |
| 2015 | 164.0 | 123.2 |
| 2016 | 160.6 | 118.9 |
Source: FAO 2017.
Figure 1.1 Relationship between HPI and average percentage of disposable household income spent on food.
Source: Adapted from Carolan 2013.
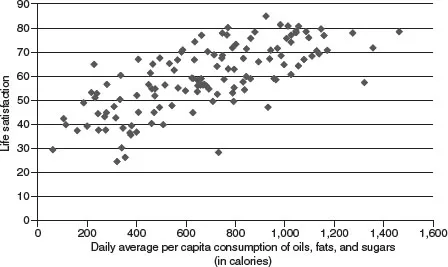
Let us pull on this thread a little longer and see what else from the conventional food narrative comes apart. As you will read in further detail in later chapters, conventional agrifood policy largely does not discriminate between calories. So: more is almost always better. To investigate the wisdom of this practice empirically, I plotted the relationship between a country’s daily average per capita consumption of oils, fats, and sugars and life satisfaction—Figure 1.2. (As we will discuss later, oils, fats, and sugars are exactly the foods that conventional practices and policies are best at making “cheap.”) As the image illustrates, the consumption of oils, fats, and sugars is positively correlated to life satisfaction in the left half of the figure. It is hard to feel well-off if you are starved, even from foods deemed “unhealthy,” though you do need some level of these elements to survive. However, at levels greater than roughly 900 calories per capita there is no positive bearing on life satisfaction. In fact, beyond this point the relationship turns slightly negative.
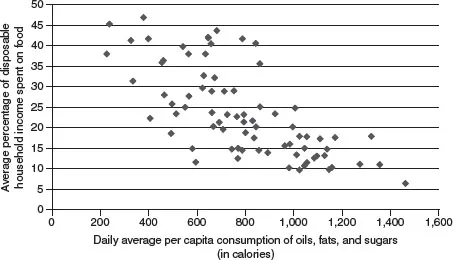
Now let us look at the relationship between daily average per capita consumption of oils, fats, and sugars and average percentage of disposable household income spent on food. We are doing this to help us better understand what we saw in Figure 1.1, where we are shown that really cheap food is actually negatively associated with wellbeing. As Figure 1.3 illustrates, as oils, fats, and sugars become cheaper—the very calories that become cheapest as food systems “modernize”—we tend to consume them at greater levels.
Box 1.1 Percent of disposable annual income spent on food—a figure worth celebrating?
Those of us in affluent nations spend less of our annual incomes today on food than any previous generation. The percentage of disposable income spent on food within the US has steadily decreased since 1947. Since 1970, the percentage of disposable income spent on all food in the US dropped from 13.9 to below 10 percent—the recent figure ranges anywhere between 6.7 and 9.9 percent, depending on who calculates it (see e.g., Barclay 2015; USDA 2016a). This decrease is even more remarkable given that more than half (50.1 percent) of what US consumers spend on food is spent eating away from home—30 years ago that figure was 34 percent and 50 years ago it was 25 percent (USDA 2016b). Let’s not forget, however, that this is an aggregate figure. The less you make, the bigger your food spending will be relative to your income. In 2013, the lowest income bracket in the US spent roughly $3,655 annually on food, or 36 percent of total income. Meanwhile, those in the highest income bracket were spending approximately $11,000 annually on food—only 8 percent of their earnings.
For some points of international comparison: residents of the Philippines and Guatemala spend about 40 percent of their disposable income on food, whereas the French and Japanese spend about 14 percent (Barclay 2015). To quote a USDA agriculture economist, after having presented this data to a reporter during an interview: “Food is still a good bargain for the American consumer” (ibid.).
We are not just consumers, however. We are also citizens, who have to live with, and pay for—sometimes even with our lives—the costs of cheap food. To quote Diep Tran (2017), a journalist and someone who comes from a family of restaurant owners, riling against cheap food lists that food critics like to pull together, especially those involving food from immigrant restaurateurs:
This view of people of color as sources of “cheap” labor bleeds into our restaurant culture: Immigrant food is often expected to be cheap, because, implicitly, the labor that produces it is expected to be cheap, because that labor has historically been cheap. And so pulling together a “cheap eats” list rather than, say, an “affordable eats” list both invokes that history and reinforces it by prioritizing price at the expense of labor.
That is what this book is about: all those costs we ignore when in search of cheap eats.
Figure 1.2 Relationship between daily average per capita consumption of oils, fats, and sugars (in calories) and life satisfaction.
Source: Carolan 2013.
Figure 1.3 Relationship between daily average per capita consumption of oils, fats, and sugars (in calories) and average percentage of disposable household income spent on food ($15,000 or greater GDP per capita).
Source: Carolan 2013.
A recently published analysis supports this point that conventional food policy really only makes certain foods cheap. Looking at ten different countries, the authors concluded that healthy food in all sites studied cost more than less healthy foods. In the authors’ words, “This meta-analysis provides the best evidence until today of price differences of healthier vs. less healthy foods/diet patterns, highlighting the challenges and opportuni...