- 288 pages
- English
- ePUB (mobile friendly)
- Available on iOS & Android
eBook - ePub
Graph Theory (on Demand Printing Of 02787)
About this book
An effort has been made to present the various topics in the theory of graphs in a logical order, to indicate the historical background, and to clarify the exposition by including figures to illustrate concepts and results. In addition, there are three appendices which provide diagrams of graphs, directed graphs, and trees. The emphasis throughout is on theorems rather than algorithms or applications, which however are occaisionally mentioned.
Trusted by 375,005 students
Access to over 1.5 million titles for a fair monthly price.
Study more efficiently using our study tools.
Information
Subtopic
Discrete MathematicsIndex
MathematicsCHAPTER 1
DISCOVERY!
Eureka!
ARCHIMEDES
It is no coincidence that graph theory has been independently discovered many times, since it may quite properly be regarded as an area of applied mathematics.* Indeed, the earliest recorded mention of the subject occurs in the works of Euler, and although the original problem he was considering might be regarded as a somewhat frivolous puzzle, it did arise from the physical world. Subsequent rediscoveries of graph theory by Kirchhoff and Cayley also had their roots in the physical world. Kirchhoff’s investigations of electric networks led to his development of the basic concepts and theorems concerning trees in graphs, while Cayley considered trees arising from the enumeration of organic chemical isomers. Another puzzle approach to graphs was proposed by Hamilton. After this, the celebrated Four Color Conjecture came into prominence and has been notorious ever since. In the present century, there have already been a great many rediscoveries of graph theory which we can only mention most briefly in this chronological account.
THE KÖNIGSBERG BRIDGE PROBLEM
Euler (1707–1782) became the father of graph theory as well as topology when in 1736 he settled a famous unsolved problem of his day called the Königsberg Bridge Problem. There were two islands linked to each other and to the banks of the Pregel River by seven bridges as shown in Fig. 1.1. The problem was to begin at any of the four land areas, walk across each bridge exactly once and return to the starting point. One can easily try to solve this problem empirically, but all attempts must be unsuccessful, for the tremendous contribution of Euler in this case was negative, see [E5].
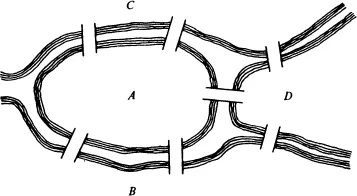
Fig. 1.1. A park in Königsberg, 1736.
In proving that the problem is unsolvable, Euler replaced each land area by a point and each bridge by a line joining the corresponding points, thereby producing a “graph.” This graph* is shown in Fig. 1.2, where the points are labeled to correspond to the four land areas of Fig. 1.1. Showing that the problem is unsolvable is equivalent to showing that the graph of Fig. 1.2 cannot be traversed in a certain way.
Rather than treating this specific situation, Euler generalized the problem and developed a criterion for a given graph to be so traversable; namely, that it is connected and every point is incident with an even number of lines. While the graph in Fig. 1.2 is connected, not every point is incident with an even number of lines.
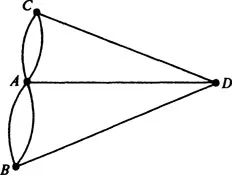
Fig. 1.2. The graph of the Königsberg Bridge Problem.
ELECTRIC NETWORKS
Kirchhoff [K7] developed the theory of trees in 1847 in order to solve the system of simultaneous linear equations which give the current in each branch and around each circuit of an electric network. Although a physicist, he thought like a mathematician when he abstracted an electric network with its resistances, condensers, inductances, etc., and replaced it by its corresponding combinatorial structure consisting only of points and lines without any indication of the type of electrical element represented by individual lines. Thus, in effect, Kirchhoff replaced each electrical network by its underlying graph and showed that it is not necessary to consider every cycle in the graph of an electric network separately in order to solve the system of equations. Instead, he pointed out by a simple but powerful construction, which has since become standard procedure, that the independent cycles of a graph determined by any of its “spanning trees” will suffice. A contrived electrical network N, its underlying graph G, and a spanning tree T are shown in Fig. 1.3.
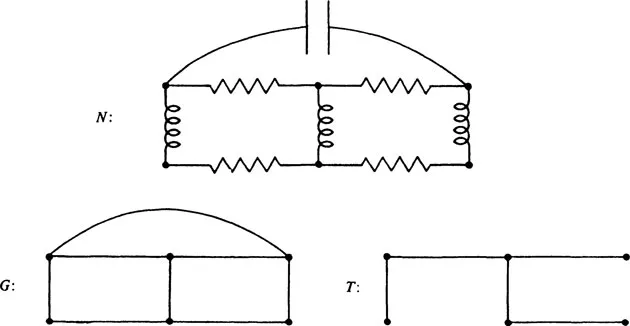
Fig. 1.3. A network N, its underlying graph G, and a spanning tree T.
CHEMICAL ISOMERS
In 1857, Cayley [C2] discovered the important class of graphs called trees by considering the changes of variables in the differential calculus. Later, he was engaged in enumerating the isomers of the saturated hydrocarbons CnH2n + 2, with a given number n of carbon atoms, as shown in Fig. 1.4.
Of course, Cayley restated the problem abstractly: find the number of trees with p points in which every point has degree 1 or 4. He did not immediately succeed in solving this and so he altered the problem until he was able to enumerate: rooted trees (in which one point is distinguished from the others), trees, trees with points of degree at most 4, and finally the chemical problem of trees in which every point has degree 1 or 4, see [C3]. Jordan later (1869) independently discovered trees as a purely mathematical discipline, and Sylvester (1882) wrote that Jordan did so “without having any suspicion of its bearing on modern chemical doctrine,” see [K10, p. 48].
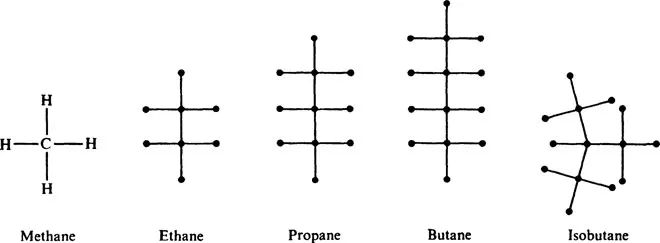
Fig. 1.4. The smallest saturated hydrocarbons.
AROUND THE WORLD
A game invented by Sir William Hamilton* in 1859 uses a regular solid dodecahedron whose 20 vertices are labeled with the names of famous cities. The player is challenged to travel “around the world” by finding a closed circuit along the edges which passes through each vertex exactly once. Hamilton sold his idea to a maker of games for 25 guineas; this was a shrewd move since the game was not a financial success.
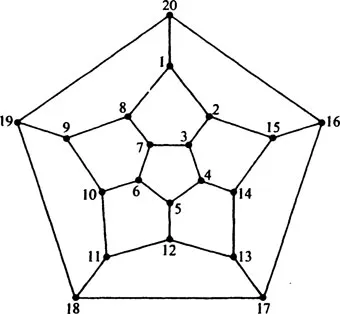
Fig. 1.5. “Around the world.”
In graphical terms, the object of the game is to find a spanning cycle in the graph of the dodecahedron, shown in Fig. 1.5. The points of the graph are marked 1,2, …, 20 (rather than Amsterdam, Ann Arbor, Berlin, Budapest, Dublin, Edinburgh, Jerusalem, London, Melbourne, Moscow, Novosibirsk, New York, Paris, Peking, Prague, Rio di Janeiro, Rome, San Francisco, Tokyo, and Warsaw), so that the existence of a spanning cycle is evident.
THE FOUR COLOR CONJECTURE
The most famous unsolved problem in graph theory and perhaps in all of mathematics is the celebrated Four Color Conjecture. This remarkable problem can be explained in five minutes by any mathematician to the so- called man in the street. At the end of the explanation, both will understand the problem, but neither will be able to solve it.
The following quotation from the definitive historical article by May [M5] states the Four Color Conjecture and describes its role:
[The conjecture states that] any map on a plane or the surface of a sphere can be colored with only four colors so that no two adjacent countries have the same color. Each country must consist of a single connected region, and adjacent countries are those having a boundary line (not merely a single point) in common. The conjecture has acted as a catalyst in the branch of mathematics known as combinatorial topology and is closely related to the currently fashionable field of graph theory. More than half a century of work by many (some say all) mathematicians has yielded proofs for special cases … The consensus is that the conjecture is correct but unlikely to be proved in general. It seems destined to retain for some time the distinction of being both the simplest and most fascinating unsolved problem of mathematics.
The Four Color Conjecture has an interesting history, but its origin remains somewhat vague. There have been reports that Möbius was familiar with this problem in 1840, but it is only definite that the problem was communicated to De Morgan by Guthrie about 1850. The first of many erroneous “proofs” of the conjecture was given in 1879 by Kempe [K6]. An error was found in 1890 by Heawood [H38] who showed, however, that the conjecture becomes true when “four” is replaced by “five.” A counterexample, if ever found, will necessarily be extremely large and complicated, for the conjecture was proved most recently by Ore and Stemple [OS1] for all maps with fewer than 40 countries.
The Four Color Conjecture is a problem in graph theory because every map yields a graph in which the countries (including the exterior region) are the points, and two points are joined by a line whenever the corresponding countries are adjacent. Such a graph obviously can be drawn in the plane without intersecting lines. Thus, if it is possible to color the points of every planar graph with four or fewer colors so that adjacent points have different colors, then the Four Color Conjecture will have been proved.
GRAPH THEORY IN THE 20TH CENTURY
The psychologist Lewin [L2] proposed in 1936 that the “life space” of an individual be represented by a planar map.* In such a map, the regions would represent the various activities of a person, such as his work environment, his home, and his hobbies. It was pointed out that Lewin was actually dealing with graphs, as indicated by Fig. 1.6. This viewpoint led the psychologists at the Research Center for Group Dynamics to another psychological interpretation of a graph, in which people are represented by points and interpersonal relations by lines. Such relations include love, hate, communication, and power. In fact, it was precisely this approach which led the author to a personal discovery of graph theory, aided and abetted by psychologists L. Festinger and D. Cartwright.
Fig. 1.6. A map and its corresponding graph.
The world of theoretical physics discovered graph theory for its own purposes more than once. In the study of statistical mechanics by Uhlenbeck [U1], the points stand for molecules and two adjacent points indicate nearest neighbor interaction of some physical kind, for example, magnetic attraction or repulsion. In a similar interpretation by Lee and Yang [LY1], the points stand for small cubes in euclidean space, where each cube may or may not be occupied by a molecule. Then two points are adjacent whenever both spaces are occupied. Another aspect of physics employs graph theory rather as a pictorial device. Feynmann [F3] proposed the diagram in which the points represent physical particles and the lines represent paths of the particles after collisions.
The study of Markov chains in probability theory (see, for example, Feller [F2, p. 340]) involves directed graphs in the sense that events are represented by points, and a directed line from one point to another indicates a positive probability of direct succession of these two events. This is made explicit in the book [HNC1, p. 371] in which a Markov chain is defined as a network with the sum of the values of the directed lines from each point equal to 1. A similar representation of a directed graph arises in that part of numerical analysis involving matrix inversion and the calculation ...
Table of contents
- Cover
- Title Page
- Copyright Page
- Dedication
- Table of Contents
- 1 Discovery
- 2 Graphs
- 3 Blocks
- 4 Trees
- 5 Connectivity
- 6 Partitions
- 7 Traversability
- 8 Line Graphs
- 9 Factorization
- 10 Coverings
- 11 Planarity
- 12 Colorability
- 13 Matrices
- 14 Groups
- 15 Enumeration
- 16 Digraphs
- Appendix I Graph Diagrams
- Appendix II Digraph Diagrams
- Appendix III Tree Diagrams
- Bibliography
- Index of Symbols
- Index of Definitions
Frequently asked questions
Yes, you can cancel anytime from the Subscription tab in your account settings on the Perlego website. Your subscription will stay active until the end of your current billing period. Learn how to cancel your subscription
No, books cannot be downloaded as external files, such as PDFs, for use outside of Perlego. However, you can download books within the Perlego app for offline reading on mobile or tablet. Learn how to download books offline
Perlego offers two plans: Essential and Complete
- Essential is ideal for learners and professionals who enjoy exploring a wide range of subjects. Access the Essential Library with 800,000+ trusted titles and best-sellers across business, personal growth, and the humanities. Includes unlimited reading time and Standard Read Aloud voice.
- Complete: Perfect for advanced learners and researchers needing full, unrestricted access. Unlock 1.5M+ books across hundreds of subjects, including academic and specialized titles. The Complete Plan also includes advanced features like Premium Read Aloud and Research Assistant.
We are an online textbook subscription service, where you can get access to an entire online library for less than the price of a single book per month. With over 1.5 million books across 990+ topics, we’ve got you covered! Learn about our mission
Look out for the read-aloud symbol on your next book to see if you can listen to it. The read-aloud tool reads text aloud for you, highlighting the text as it is being read. You can pause it, speed it up and slow it down. Learn more about Read Aloud
Yes! You can use the Perlego app on both iOS and Android devices to read anytime, anywhere — even offline. Perfect for commutes or when you’re on the go.
Please note we cannot support devices running on iOS 13 and Android 7 or earlier. Learn more about using the app
Please note we cannot support devices running on iOS 13 and Android 7 or earlier. Learn more about using the app
Yes, you can access Graph Theory (on Demand Printing Of 02787) by Frank Harary in PDF and/or ePUB format, as well as other popular books in Mathematics & Discrete Mathematics. We have over 1.5 million books available in our catalogue for you to explore.