Who's Who in Modern History is a unique reference book which examines those individuals who have shaped the political world since 1860. Coverage is truly global, including the most important figures in Europe, Asia, North America, Latin America, Africa and Australasia.
It provides:
* an easy-to-use A-Z layout
* authoritative, detailed biographies of the most important figures since 1860, from Clemenceau and Chief Buthelezi to King Fahd and Benazir Bhutto
* bibliographical references for each entry, to aid further research
* extensive cross-referencing
* an essential guide for students, researchers and the general reader alike.

- 48 pages
- English
- ePUB (mobile friendly)
- Available on iOS & Android
eBook - ePub
Who's Who in Modern History
About this book
Trusted by 375,005 students
Access to over 1.5 million titles for a fair monthly price.
Study more efficiently using our study tools.
Information
1.0 Introduction
The main structure of a tall building and its façade must be designed to safely withstand the extreme winds to which the building will be subjected during its expected life. Determining what the wind loads will be for specific mean recurrence intervals, and what the uncertainties are in these loads is critical. The wind loads, and appropriate load factors that allow for uncertainty in ordinary buildings, are often prescribed by the analytical methods given in building codes. But for tall buildings, in view of the importance of wind loads to their cost and safety, these analytical methods often lack the precision needed. Also, they do not account well for important wind phenomena, such as crosswind excitation, aerodynamic interactions between adjacent buildings, and aerodynamic instability, all of which affect not only loads but may also cause building motions that occupants find excessive. For these reasons, the wind loads and motions of tall buildings are typically determined by wind tunnel tests on scale models of the building and its surroundings, through which much more precise, project-specific information is obtained. Computational Fluid Dynamics (CFD) is increasingly used for qualitative evaluation of wind effects, particularly ground-level wind speeds, but is not yet capable of providing quantitative results of sufficient accuracy for the determination of design wind loads.
The objective of this document is to lay out general guidelines for wind tunnel tests, as applied to tall buildings, in a format that is useful to building professionals and regulatory authorities involved in tall buildings, as well as wind specialists. It is not intended to be a detailed manual of practice, such as is provided in: ASCE, 1999; AWES, 2001; BCJ, 1993 & 2008; KCTBUH, 2009; and ASCE 49–12, 2012. However, it is intended to describe best practice and make it easier to compare results from different wind consultants.
1.1 Basis of Design
Wind tunnel testing involves highly developed and specialized methodologies and terminology. Designers, developers, and building officials cannot be expected to have the in-depth knowledge of such a specialized field but it will help them to obtain most value from wind tunnel tests of their projects if they have a basic understanding of the principles involved. Also, as with any branch of knowledge, it is important to be aware of the sources of uncertainty in wind studies so that proper judgement can be exercised when applying the results or comparing results from different wind tunnel test laboratories.
The wind load formulae of building codes have been developed primarily for low-rise buildings and typically address, with a few exceptions, only wind loads in the along-wind direction. They are specified as the product of various factors, such as a reference pressure q, an exposure factor k, a drag coefficient Cd, and a gust factor Cg. This has sometimes led to the expectation that the purpose of the wind tunnel test is simply to determine the drag coefficient and possibly the gust factor, the values of which are then to be inserted into the formula. This expectation misses the important point that, for buildings dominated by crosswind loading, the format of the typical code formula does not capture the essential physics of the problem. The objective of the wind tunnel tests is to fully replicate the real physics of wind loading at model scale. This includes along-wind loading, crosswind loading, torsional loading, load combinations, building motions, local wind pressures for cladding design, and the influences of terrain roughness, topography, directionality, and other nearby structures (see Figure 1.1).
The wind load formulae of building codes have been developed primarily for low-rise buildings and typically address only wind loads in the along-wind direction.

▴ Figure 1.1: Tall buildings designed for dense urban settings such as Chicago (above) benefit from the precise, project-specific information obtained from wind tunnel testing.

▴ Figure 1.2: The Alan G. Davenport Chain of Wind Loading.
When does a building’s height make it sufficiently sensitive to dynamic effects and crosswind loading to require a wind tunnel test? The answer depends on many factors, including its shape, exposure, slenderness, structural system, and the wind regime of the site location. A wind tunnel test may be advisable if any one of the following applies:
(i) The height of the building is over 120 meters.
(ii) The height of the building is greater than four times its average bev (width normal to the wind direction over the top half of the building).
(iii) The lowest natural frequency of the building is less than 0.25 Hz.
(iv) The reduced velocity U/(f1bav) at ultimate conditions is greater than five, where U is the mean hourly wind velocity evaluated at the top of the building, f1 is the lowest natural frequency of the building and bav is the average width defined in (ii).
It should be noted that these are approximate guidelines only, and can depend on other factors, such as exposure of the building being considered, local topography, and the presence of other major buildings in the proximity.
There are five key steps involved in determining wind loadings derived from wind tunnel tests. This has been described as a “chain” (Davenport 1982), which is appropriate, since the outcome is only as strong as the weakest link. The Alan G. Davenport Chain is illustrated in Figure 1.2.
The first link in the chain is the wind climate, i.e., the statistics of the wind speed and direction for the region where the building is located.The next link is the influence of the surrounding terrain, including the surface roughness and topography (see Figure 1.3). This is followed by a link representing the local aerodynamics of the building and interference effects from other nearby structures.The next link, dynamic effects, represents the building’s wind-induced response, including any aeroelastic effects. The final link represents the criteria used to assess the building and its response to wind. The objective of present-day wind tunnel studies is to evaluate each link in detail using rational methods and with maximum accuracy. Then, when all links are assembled, the final answer is the best available using rational scientific knowledge. If one or more of the links is not treated with due diligence, the value of the whole study can be seriously degraded. For this reason, it is usually not a good idea to break off one part of the chain of the wind tunnel study and substitute part of the code analytical procedure, which is inherently more approximate, in its place. The analytical procedure of the code and the wind tunnel procedure are best treated as two totally separate processes, each targeted at the same level of structural reliability, and only their end results compared.
1.2 Wind Climate
Wind climate involves the statistics of wind speed and direction. Building codes generally specify the recurrence interval and the corresponding wind speed at a selected reference height, typically at 10 meters in open terrain. Some codes go so far as to specify different wind speeds for different wind directions. Depending on the country involved and the location within that country, more or less effort will have gone into the determination of the appropriate design wind speed. Where the design wind speed is based on well documented research by established experts, it would be normal for the wind tunnel laboratory to make predictions based on a statistical wind model that matches that speed. However, tall buildings are sometimes built in areas where the research resources have not been available to determine an accurate design speed and there has been little prior experience with tall structures. In such cases the determination of design wind speed made by the wind tunnel laboratory’s experts may well be more reliable and rational than the code speed. Indeed, there are some jurisdictions where the code wind speed has been updated based on the results of studies done for a specific tall building. The fact is that tall buildings are extremely sensitive to wind speed and direction. Therefore, every effort should be made to determine the statistics of these parameters in the most rational manner possible.
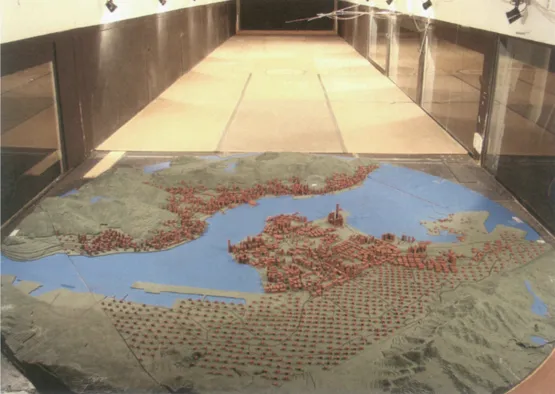
▴ Figure 1.3: Topography model test of Hong Kong. © CPP
The first stage of any wind engineering study is to conduct a wind climate analysis for the development site. The most common sources of wind data are anemometer records from local meteorological stations, usually located at airports.These data are often available for each hour of the record period, but at some locations may not be available at such frequent intervals, or there may be gaps in the record. While the ideal anemometer location would be surrounded by flat, open terrain in all directions, this ideal situation is typically not realized. Therefore the records need to be corrected back to the standard “open-country” condition to make them comparable to other locations and to code-defined wind speeds. This is typically done using a methodology such as that published by ESDU (1993), which takes account of the effects of terrain changes on wind characteristics. This same methodology can then be used to adjust the open-country data to site wind conditions, taking account of the roughness upwind from the site for each approach direction.
The number of years for which meteorological records are available is important in obtaining statistical reliability. A 15-year or longer period is desirable.
The existing practice is to assume that the statistics of the past wind climate give a good indication of the future. This practice has been questioned in recent years on account of climate change predictions, but currently the uncertainties in predicting the probable effects on extreme winds have resulted in no clearly identifiable trend. If and when clear trends are predicted, existing practice may need to be modified. Apart from their statistical reliability, interpretation of wind records is subject to other complicating factors.
Anemometers are not infrequently moved to a different location and height, and the roughness of the terrain surrounding them may have changed during the period of record. Also, recording errors have been known to degrade confidence in the data. These effects need to be taken into account as much as possible, but clearly they introduce added uncertainty beyond that coming from pure length of record. The uncertainties connected with individual meteorological stations can be reduced by examining more than one station in a given region. This is sometimes done using the “superstation” concept (Peterka & Shahid 1998), in which records from a number of nearby meteorological stations are combined into a single record, effectively creating a longer record length and an increased statistical reliability.
An important parameter for meteorological studies is the averaging time used for recording the anemometer data. Various averaging times are used, ranging from one hour to one minute. This needs to be taken into account in the analysis of data. Also, at some meteorological stations, peak daily gusts are recorded with durations on the order of one to three seconds. These can be useful in cross-checking the hourly data, and may also provide additional information on the terrain roughness and short-duration wind events, such as thunderstorms.
Since meteorological station anemometers are typically located at a height of 10 meters, it is clearly a considerable extrapolation to infer from them the wind statistics at the tops of tall buildings, some of which are now encroaching on the one-kilometer mark. Experience indicates that current extrapolation methods, using standard models of the planetary boundary layer, work reasonably well in practice for buildings up to 300 or 400 meters. However, it is desirable to obtain more direct information on winds at altitude, i.e., above 400 meters. At some locations, many fewer than those with ground-based stations, this is available in the form of balloon records. Unfortunately they are often only available at three-hour intervals at best, and more often than not, only at six-hour or 12-hour intervals, and frequently have missing records due to balloon malfunction or other reasons. However, provided one recognizes the uncertainty caused by the sparseness of the data set, baloon stations can shed some additional light on upper-level winds.
Another source is the United States’ National Center for Atmospheric Research / National Center for Environmental Prediction (NCAR/NCEP) global reanalysis data set. These data are based on worldwide meteorological observations interpolated to a three-dimensional grid by means of meteorological modeling. The NCAR/NCEP global reanalysis dataset has been generated by the weather forecasting community. These data are now available on a worldwide grid at multiple levels, with spatial resolutions varying from 12 kilometers in some parts of the world to 200 kilometers in others, and temporal resolutions in the 3–6 hour range. The spatial and temporal resolutions can be enh...
Table of contents
- Cover
- Half Title
- The Routledge Who’s Who series
- Title Page
- Copyright Page
- Table of Contents
- Dedication
- Preface to the 1996 Edition
- Who's Who in Modern History
Frequently asked questions
Yes, you can cancel anytime from the Subscription tab in your account settings on the Perlego website. Your subscription will stay active until the end of your current billing period. Learn how to cancel your subscription
No, books cannot be downloaded as external files, such as PDFs, for use outside of Perlego. However, you can download books within the Perlego app for offline reading on mobile or tablet. Learn how to download books offline
Perlego offers two plans: Essential and Complete
- Essential is ideal for learners and professionals who enjoy exploring a wide range of subjects. Access the Essential Library with 800,000+ trusted titles and best-sellers across business, personal growth, and the humanities. Includes unlimited reading time and Standard Read Aloud voice.
- Complete: Perfect for advanced learners and researchers needing full, unrestricted access. Unlock 1.5M+ books across hundreds of subjects, including academic and specialized titles. The Complete Plan also includes advanced features like Premium Read Aloud and Research Assistant.
We are an online textbook subscription service, where you can get access to an entire online library for less than the price of a single book per month. With over 1.5 million books across 990+ topics, we’ve got you covered! Learn about our mission
Look out for the read-aloud symbol on your next book to see if you can listen to it. The read-aloud tool reads text aloud for you, highlighting the text as it is being read. You can pause it, speed it up and slow it down. Learn more about Read Aloud
Yes! You can use the Perlego app on both iOS and Android devices to read anytime, anywhere — even offline. Perfect for commutes or when you’re on the go.
Please note we cannot support devices running on iOS 13 and Android 7 or earlier. Learn more about using the app
Please note we cannot support devices running on iOS 13 and Android 7 or earlier. Learn more about using the app
Yes, you can access Who's Who in Modern History by Alan Palmer in PDF and/or ePUB format, as well as other popular books in History & Historical Biographies. We have over 1.5 million books available in our catalogue for you to explore.