- 340 pages
- English
- ePUB (mobile friendly)
- Available on iOS & Android
eBook - ePub
About this book
The telecommunications industry is one of the most influential and significant global industries. As well as being fundamentally important to the health of the modern economy, it is going through a period of unprecedented change, facing a range of strategic challenges from globalization and cross-border alliances, to changing technologies and consu
Information
Chapter 1
Structural overview
And when they were up, they were up
Introduction
The purpose of this introductory chapter is to ‘set the scene’ for the ten case studies that form the bulk of the book. One of the obvious drawbacks to books involving case studies is that there are no links at all between them -different industries, different time periods and different levels of detail are involved. This book sets out to overcome these difficulties by covering a single, albeit substantial, industrial sector, a common time period and a very similar level of detail. However, it is still possible to get so involved with the specifics of individual cases as to lose sight of the bigger picture: at the end of the day, not only must all of the companies have been responding in part to the same set of external pressures, but they must in many cases have been interacting with one another either as partners or competitors.
Although it is not possible in an introductory chapter to cover all of these matters in detail, the discussion that follows, which contains a rich data base, should help to clarify a number of issues for the reader, and, in particular, make it possible to cross-reference back from the case studies in respect of events such as mergers. Where entries are important in relation to the case studies, they appear in bold. It may be noted that one company, Kirch, does not appear in any of the tables. Without going into a lengthy discussion of why that is at this stage, it should simply be borne in mind that not all significant developments involve large quoted companies.
The industrial sector into which all of the case studies fall is generally known as Technology, Media and Telecommunications (TMT). However, the former is largely excluded from the list of case studies here, partly to maintain focus and partly because the term ‘technology’ covers such a wide range of possibilities, including all kinds of software and hardware, with most relevant companies having only a tenuous relationship to the telecoms and media industries. Put crudely, the media companies are included because they provide the content, and the telecoms companies (known generally as operators or carriers) because they provide the networks that carry that content to the users. This distinction was historically fairly clear-cut, but has become much less so in recent years because of the Internet, as is shown in the case studies. However, our case studies can be clearly divided into these two categories for analytical purposes. The relationship between content providers and operators is necessarily very close, although one of the most interesting, and as yet unresolved, questions is whether operators need content more or less than media companies need operators.
Ranking the companies
It is not possible to provide a definitive overview of the TMT sector because, among other issues, those who seek to sell this information at high prices have a vested interest in defining their terms somewhat differently from everyone else seeking to do the same thing. What is crucial, when all is said and done, is to have a set of data that is consistently defined and covers the period under investigation. Given the industries under review, the critical period is from the beginning of 1997 to the present day, which in this case is December 2003 – although it is not possible to be quite so up to date because most data are only published once a year. For this reason, we have chosen to utilize the annual data that encompass the 500 largest companies as defined by the Financial Times. The broad picture presented by the relevant sections of the FT500 is laid out in Table 1.1.1 As can be seen, size is defined here by reference to the capital values of the companies listed. There are several reasons for this. In particular, capitalization (market value) is easily measured and can be adjusted on a daily basis to allow for a rolling comparison. In addition, while concepts such as revenue or profit are conventionally used in this context – for example, Fortune magazine's US500 is based upon revenue – they are increasingly unhelpful in a ‘virtual’ world where there can be (and, indeed, have been, although few cases currently exist) a significant number of companies that earn negligible revenues and make ongoing losses, yet have capital values running into the billions of dollars. A particular problem with both revenue and profit data is that they are only declared a few times each year, in arrears and, generally, with more than an element of imprecision (as some case studies demonstrate). In contrast, capital values are available from stock markets on a daily basis, and, in theory at least, take account of all known facts about a company as well as its future prospects, suitably discounted to the present day.
Table 1.1 concentrates upon what in 1998 were classified as ‘telephone companies’ and from 1999 onwards as ‘telecoms’, but is intended to be representative of all links in the supply chain from the creation of content to the delivery of data, encompassing a sample of companies in the broadcasting media, computer software and services, communications equipment and other sectors. Hence, although only one case study is of a ‘technology’ company, the most relevant of these in the sense of, for example, specialising in the provision of telecomunications equipment, are included in this overview to indicate their place in the greater scheme of things. The choice of companies is necessarily somewhat arbitrary because the telecommunications sector, if defined as TMT, encompasses a range of very different types of business, both ‘old economy’ and ‘new economy’, and mergers and acquisitions (M&A) activity during the period 1998 to 2001 had significant structural consequences. However, given that our purpose is to examine reasonably broad trends which would not be affected by the inclusion or exclusion of a handful of companies, the sample is more than adequate for our purposes.
Table 1.1 ranks companies at the end of six successive periods of roughly one calendar year, encompassing the beginning of 1997 to the end of March 2003 inclusive. All of the companies in the main section of the table were numbered among the FT500 in the year to 28 March 2003, but not necessarily in every previous period. It is rare, in practice, for a TMT company to return to the FT500 once having fallen below the minimum size to qualify, but it is of importance for our analysis to include those companies that have ceased to be listed during the period of TMT decline commencing at the beginning of 2000. In the table, accordingly, 54 companies are listed for 2002 (strictly, 28 March 2002 to 28 March 2003) compared to 57 companies for 2001 (in this – exceptional – case a 15-month period). Of the 54, three were new entries, while six had disappeared from the 2001 list. In contrast, the new entrants in 2001 were massively outweighed by those departing which numbered 23 of the 76 listed in 2000, as was true of the 21 listed in 1999 which failed to make the list in 2000. Overall, therefore, it is clear that there has been considerable attrition during the period January 1999 to March 2003, but also that the process slowed sharply between March 2002 and March 2003. It may naturally be argued that as the residual number of surviving companies shrinks, the attrition rate must sooner or later slow down, but as noted the reduction in the attrition rate during 2002 was very marked.
What this indicates strongly, and this can readily be borne out by looking backwards rather than forwards from 1999, is that 1999 was a clearly defined peak year for the TMT sector. In that year, 87 of the largest 500 companies qualified for the data set, whereas in 1997 there were a mere 36. Furthermore, 67 of the 87 were listed in the top 250. In other words, companies in the TMT sector literally burst upon the scene during a two-year period in a manner that has no historical precedent. This immediately leads to one initial conclusion. No set of companies can actually grow internally at such a rate as to overtake companies in every other industrial sector in so short a time. Hence, one of two things must have happened: Either there was an extraordinarily large and speedy process of M&A activity during these two years or the market values of this particular group of companies were raised much faster than for others on the grounds that its future prospects had suddenly improved beyond all expectation. We will return to these matters in due course. Suffice it to say for now that, if anything, the situation was even more extreme than it appeared to be since M&A activity which is launched in a particular year may often not reach fruition until a later year because of the delays in the obtaining of regulatory approvals. Nevertheless, a word of
Table 1.1 Telecommunications companies in the FT500, December 1997-March 2003
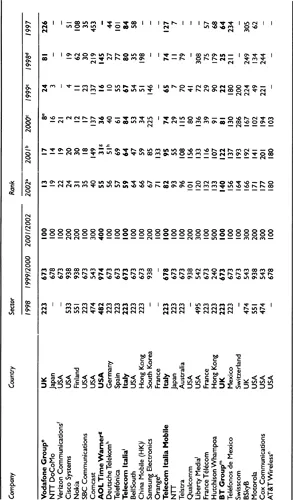
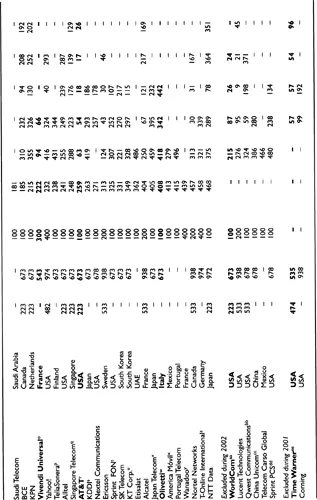
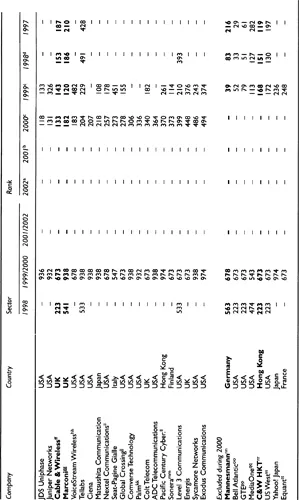
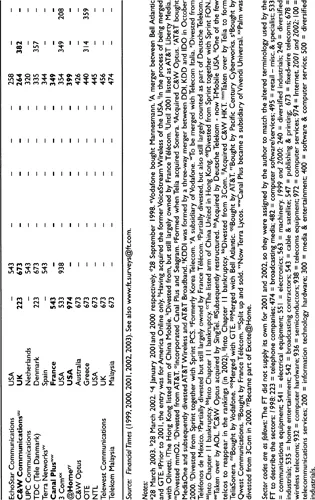
caution is also in order because sectoral dominance of this kind is not a unique phenomenon, having been even more marked with respect to the railway and banking industries in earlier periods even if it took much longer to appear.
It is worth observing that only 37 of the 2002 entries appear in the top 250 compared to 67 companies in 1999. In other words, more than one in four of the most highly capitalized 250 companies in the world in 1999 were in some way associated with telecommunications, whereas in 2002 it was nearer one in eight. It is also notable that 23 companies are listed across all six years of the table, and a further eight are listed over the most recent five years. On the face of it, this represents only a modest rump of longer-term survivors, and raises a question mark over the prospects for the sector. Given that there is so much talk – but much less action – in relation to consolidation, it must be borne in mind that if this takes the form of M&A activity among the larger companies then the TMT presence among the FT500 will probably continue to decline, whereas M&A activity involving second-tier companies may create new entrants.
Another interesting aspect of Table 1.1 is what it tells us about the geographical dispersion of the major TMT companies. In 1999, 37 of these were based in the USA, and almost as many in 2000. However, of the 54 companies listed in 2002, only 16 were domiciled in the USA compared to 20 in Western Europe and 11 in the Far East. It is noteworthy that four of the six departures during 2002 were from the USA as well as 15 during 2001 and eight during 1999 – 27 in total. This can be compared with the zero, six and nine departures respectively by European companies – 15 in total but mostly at the beginning of the period. In other words, the TMT sector in ...
Table of contents
- Cover
- Half Title
- Full Title
- Copyright
- Contents
- List of Illustrations
- Preface
- Acknowledgements
- List of Abbreviations
- 1 Structural overview
- 2 Strategic models
- PARTI I llustrative application of strategic modelling I
- PART II Illustrative application of strategic modelling II
- PART III Illustrative application of strategic modelling III
- PART IV Illustrative application of strategic modelling IV
- Glossary
- Notes
- Reference
- Index
Frequently asked questions
Yes, you can cancel anytime from the Subscription tab in your account settings on the Perlego website. Your subscription will stay active until the end of your current billing period. Learn how to cancel your subscription
No, books cannot be downloaded as external files, such as PDFs, for use outside of Perlego. However, you can download books within the Perlego app for offline reading on mobile or tablet. Learn how to download books offline
Perlego offers two plans: Essential and Complete
- Essential is ideal for learners and professionals who enjoy exploring a wide range of subjects. Access the Essential Library with 800,000+ trusted titles and best-sellers across business, personal growth, and the humanities. Includes unlimited reading time and Standard Read Aloud voice.
- Complete: Perfect for advanced learners and researchers needing full, unrestricted access. Unlock 1.4M+ books across hundreds of subjects, including academic and specialized titles. The Complete Plan also includes advanced features like Premium Read Aloud and Research Assistant.
We are an online textbook subscription service, where you can get access to an entire online library for less than the price of a single book per month. With over 1 million books across 990+ topics, we’ve got you covered! Learn about our mission
Look out for the read-aloud symbol on your next book to see if you can listen to it. The read-aloud tool reads text aloud for you, highlighting the text as it is being read. You can pause it, speed it up and slow it down. Learn more about Read Aloud
Yes! You can use the Perlego app on both iOS and Android devices to read anytime, anywhere — even offline. Perfect for commutes or when you’re on the go.
Please note we cannot support devices running on iOS 13 and Android 7 or earlier. Learn more about using the app
Please note we cannot support devices running on iOS 13 and Android 7 or earlier. Learn more about using the app
Yes, you can access Telecommunications Strategy by Peter Curwen,Jason Whalley in PDF and/or ePUB format, as well as other popular books in Business & Business General. We have over one million books available in our catalogue for you to explore.