Analyzing high-dimensional gene expression and DNA methylation data with R is the first practical book that shows a ``pipeline" of analytical methods with concrete examples starting from raw gene expression and DNA methylation data at the genome scale. Methods on quality control, data pre-processing, data mining, and further assessments are presented in the book, and R programs based on simulated data and real data are included. Codes with example data are all reproducible.
Features: • Provides a sequence of analytical tools for genome-scale gene expression data and DNA methylation data, starting from quality control and pre-processing of raw genome-scale data. • Organized by a parallel presentation with explanation on statistical methods and corresponding R packages/functions in quality control, pre-processing, and data analyses (e.g., clustering and networks). • Includes source codes with simulated and real data to reproduce the results. Readers are expected to gain the ability to independently analyze genome-scaled expression and methylation data and detect potential biomarkers.
This book is ideal for students majoring in statistics, biostatistics, and bioinformatics and researchers with an interest in high dimensional genetic and epigenetic studies.
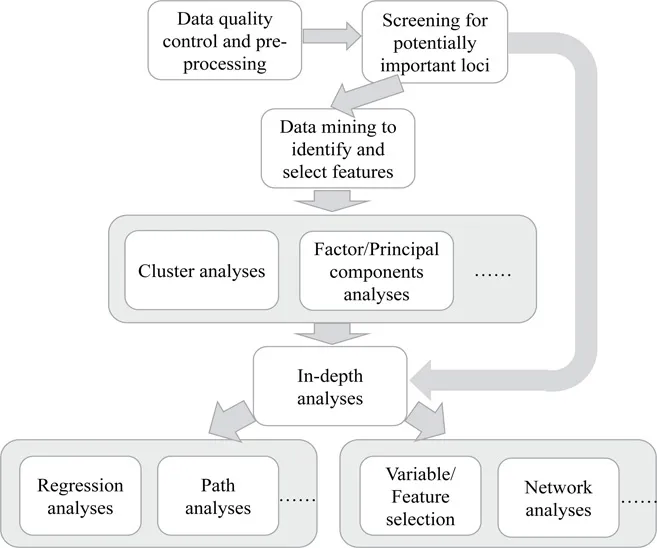
High throughput technologies allow researchers to monitor in parallel expression levels of thousands of genes or strength in DNA methylation at a vast number of CpG sites. However, raw “omics” data are usually filled with noise. For instance, both Illumina Infinium HumanMethylation450 BeadChip (450K methylation array) and the Infinium MethylationEPIC BeadChip (850K methylation array) have different probe types, each using different chemistry. The process of bisulphite conversion of DNA, chip to chip variation, and other steps introduce assay variability and batch effects. Thus before we start analyzing the data, quality control and data preprocessing are needed. Commonly applied pipelines in general all start from quality control and preprocessing (Figure 1.1). Sometimes preprocessing is omitted if doing so removes biological relevance.
Figure 1.1 An example of the pipeline to analyze “omics” data. The step of preprocessing can be omitted if this step potentially removes biological relevance.
In this book, the focus is on genome-scale gene expression data and DNA methylation data. Quality control and data preprocessing are introduced and discussed in Chapters 2 and 3, along with a brief review of the data generating process. Due to the high dimensionality of data, it is necessary to exclude uninformative loci, i.e., loci potentially not associated with the study of interest. Doing so will dramatically improve statistical power in the detection of associations or identification of biological markers. However, we have to admit that screening can end up with false negatives, that is, excluding loci which are actually informative. The methods and examples for screening are discussed in Chapter 5. Which covers methods that utilize training and testing data, surrogate variables, and an approach of sure independence screening. All these approaches are built upon regressions.
Data mining is an important step to identify underlying features and patterns in the data. Findings from this step will substantially benefit subsequent in-depth analyses. Commonly used data mining techniques include cluster analyses, factor analyses, and principal component analyses. We focus on cluster analyses in this book. Compared to factor and principal component analyses, results from cluster analyses allow researchers to concretely visualize profiles of each cluster and identify the uniqueness of each cluster. In addition, interpretation of results from cluster analyses is relatively straightforward. Cluster analyses are discussed in Chapter 5, including classical approaches such as partitioning-based methods and hierarchical clustering approaches and joint clustering methods where the clustering is two-dimensional.
Often, after screening or data mining, in-depth analyses are conducted. Standard approaches such as linear regressions or generalized linear regressions are commonly used. However, even after screening, the number of loci (or variables) can still be large. Thus, efficiently detecting markers of an exposure or for a health outcome is critical in medical research. To this end, accompanied by concrete examples, this book focuses more on methods to detect markers or select important variables. Chapters 6 and 7 introduce variable selection techniques in linear and non-linear models, and Chapter 8 discusses methods and examples for network constructions and comparisons. In some studies, DNA methylation is treated as a mediator between an exposure and a phenotype of interest. In this case, mediation analyses via path analyses can be applied. This is not covered by this book but recent studies have proposed methods to assess such mediation effects.
Through out the book, we utilize simulated data as well as real gene expression and DNA methylation data to demonstrate the analytical methods. All the programs in this book have been tested in R version 3.5.3 and/or 3.6.1. In the following sections of this chapter, we briefly introduce each real data set.
1.2 RNA-Seq gene expression in S2-DRSC cells
Brooks et al. [13] conducted a study aiming to explore the conservation of the splicing code between distantly related organisms, in particular, between Drosophila and mammals. To identify regulatory targets of Pasilla, S2-DRSC cells were treated with a 444 bp dsRNA fragment corresponding to the ps mRNA sequence. Untreated S2-DRSC were cultured in biological triplicate to serve as a control. The authors combined RNAi and RNA-Seq to identify exons regulated by Pasilla, the Drosophila melanogaster ortholog of mammalian NOVA1 and NOVA2. The RNA-Seq data for the treated and untreated cells and related information are available from the Gene Expression Omnibus (GEO) database under accession numbers GSM461176-GSM461181. The data are available https://figshare.com/s/e08e71c42f118dbe8be6. The reads were aligned to the Drosophila reference genome and summarized at the gene level. This RNA-Seq data set is utilized to demonstrate the methods and packages for clustering in Chapter 5.
1.3 Microarray gene expression in yeast cells and in prostate samples
Zhao et al. [163] examined three microarray gene expression data sets across the yeast cell cycle and identified 254 genes that are periodic in at least two data sets. Expressions of genes with periodicity were further examined in the study by [127, 114] to demonstrate their developed methods and R packages for clustering. They extracted expression data of 256 genes collected in the first 16 time points with 7-minute-intervals. As noted in Qin et al. [114], expressions of these 256 genes are cell cycle dependent. A subset of the data with 64 genes is analyzed in Chapter 5.
We also examined another microarray gene expression data set discussed in Singh et al. [129]. The raw data set has Affymetrix expressions of 52 tumoral and 50 non-tumoral prostate samples. A set of pre-processing steps were applied, including setting thresholds at 10 and 16, 000 units, excluding genes with expression variation less than 5-fold relatively or less than 500 units absolutely between samples, applying a base 10 log-transformation, and standardizing each experiment to zero mean and unit variance across the genes. In the package depthTools, expressions of 100 genes were included, representing the most variables genes in expression as noted in Dudoit et al. [30]. The variation was measured as a ratio of between-group to within-group sum of squares in expression of genes. This data set is discussed in Chapter 8.
1.4 DNA methylation in normal and colon/rectal adenocarcinoma samples
DNA methylation of 38 matched pairs is available in the Cancer Genome Atlas (TCGA) data repository. Among the 76 samples, 38 have colon and rectal adenocarcinoma. This data set is available in the DMRcate package used to identified differentially methylated regions. In this book, we utilize this data set to demonstrate methods in marker detections and variable/feature selections (Chapters 6 and 7).
Chapter 2
Genome-scale gene expression data
For genetic data, we mainly focus on gene expression data produced via Sanger sequencing and next generation sequencing. For epigenetic data, which will be discussed in the next chapter, we focus on DNA methylation of CpG sites. Single nucleotide polymorphisms in genomewide association studies will not be discussed.
2.1 Microarray gene expression data
2.1.1 Data generation
Different techniques are available to measure genome-scale gene expressions, for example, cDNA spotted arrays and oligonucleotide arrays (Figure 2.1). For cDNA spotted array, it is the first type of DNA microarray technology developed in the Brown and Botstein Labs at the Stanford University [14]. It was produced by using a robotic device, which deposits a library of thousands of distinct cDNA clones onto a coated microscope glass slide surface in serial order with a distance of approximately 200-250 μm from each other, one spot for one gene. These moderate sized glass cDNA microarrays also bear about 10,000 spots or more on an area of 3.6 cm2. Then mRNA samples or targets from two groups (e.g., treatment and control samples) were extracted, separately reverse tran...
Table of contents
Cover
Half Title
Series Page
Title Page
Copyright Page
Dedication
Contents
Preface
Chapter 1: Introduction
Chapter 2: Genome-scale gene expression data
Chapter 3: Genome-scale epigenetic data
Chapter 4: Screening genome-scale genetic and epigenetic data
Chapter 5: Cluster Analysis in Data mining
Chapter 6: Methods to select genetic and epigenetic factors based on linear associations
Chapter 7: Non- and semi-parametric methods to select genetic and epigenetic factors
Chapter 8: Network construction and analyses
Bibliography
Index
Frequently asked questions
Yes, you can cancel anytime from the Subscription tab in your account settings on the Perlego website. Your subscription will stay active until the end of your current billing period. Learn how to cancel your subscription
No, books cannot be downloaded as external files, such as PDFs, for use outside of Perlego. However, you can download books within the Perlego app for offline reading on mobile or tablet. Learn how to download books offline
Perlego offers two plans: Essential and Complete
Essential is ideal for learners and professionals who enjoy exploring a wide range of subjects. Access the Essential Library with 800,000+ trusted titles and best-sellers across business, personal growth, and the humanities. Includes unlimited reading time and Standard Read Aloud voice.
Complete: Perfect for advanced learners and researchers needing full, unrestricted access. Unlock 1.4M+ books across hundreds of subjects, including academic and specialized titles. The Complete Plan also includes advanced features like Premium Read Aloud and Research Assistant.
Both plans are available with monthly, semester, or annual billing cycles.
We are an online textbook subscription service, where you can get access to an entire online library for less than the price of a single book per month. With over 1 million books across 990+ topics, we’ve got you covered! Learn about our mission
Look out for the read-aloud symbol on your next book to see if you can listen to it. The read-aloud tool reads text aloud for you, highlighting the text as it is being read. You can pause it, speed it up and slow it down. Learn more about Read Aloud
Yes! You can use the Perlego app on both iOS and Android devices to read anytime, anywhere — even offline. Perfect for commutes or when you’re on the go. Please note we cannot support devices running on iOS 13 and Android 7 or earlier. Learn more about using the app
Yes, you can access Analyzing High-Dimensional Gene Expression and DNA Methylation Data with R by Hongmei Zhang in PDF and/or ePUB format, as well as other popular books in Computer Science & Data Processing. We have over one million books available in our catalogue for you to explore.