
- 304 pages
- English
- ePUB (mobile friendly)
- Available on iOS & Android
eBook - ePub
Probability Applications in Mechanical Design
About this book
The authors of this text seek to clarify mechanical fatigue and design problems by applying probability and computer analysis, and further extending the uses of probability to determine mechanical reliability and achieve optimization. The work solves examples using commercially available software. It is formatted with examples and problems for use
Tools to learn more effectively

Saving Books

Keyword Search

Annotating Text

Listen to it instead
Information
1
Data Reduction
Data for load carrying material properties can be modelled using any probability distribution function. Statistical goodness-of-fit tests should be applied to determine if the data set could be randomly drawn from that distribution. Modelling has progressed beyond a simple two parameter (ì,ž) Gaussian distribution. This book treats the three parameter (ä, â, ã) Weibull distribution, as well as the traditional Gaussian distribution.
Many authors relegate the subject of data reduction to an appendix at the back of the book. In the opinion of the authors, the topic deserves much more attention.
I. REDUCTION OF RAW TABULATED TEST DATA OR PUBLISHED BAR CHARTS
A computer program such as SAS (Statistical Analysis System) statistical software or other compatible software is used to fit test data to a Gaussian curve.
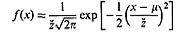
(1.1)
where -∞≤×≤+∞≤ with
μ-is the mean for an infinite sample size
ž-is the standard deviation for an infinite sample size.
The program also fits data to a Weibull curve,
ž-is the standard deviation for an infinite sample size.
The program also fits data to a Weibull curve,
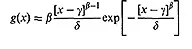
(1.2)
where γ≤×≤+∞ and g (x)=0 when x≤γ and
δ-is a scale parameter for infinite sample size
β-is a shape parameter for infinite sample size
γ-is a threshold parameter
β-is a shape parameter for infinite sample size
γ-is a threshold parameter
The computer solves for the Weibull parameters as well as the Gaussian mean and standard deviation for a set of individual values from mechanical testing or published bar charts with more than one or two samples at a given value for the mid point of the bar (cell width).
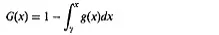
Some computer software solves for only two Weibull parameters δ and β while γ is set to zero. The failure curves f(x) and g(x) are used to generate the reliability

(1.3)
(1.4)
The Weibull G(x), g(x) and Gaussian F(x) f(x) are unity curves with values from zero to one. The Weibull and Gaussian curves are used throughout this book except in chapter four where the constant failure-rate for reliability is introduced to explain the wear and tear on machinery. The computer calculations for Eqs. (1.1) and (1.2) allows the individual data to be sorted or listed as a bar chart. Sturges Rule [1.12, 1.16] presents an acceptable means of plotting data on linear coordinates, where, the data is grouped in cells of width w, over the range R, of the data.
- Number of cells (K)=1+3.3 log10 N where N is the number of individual data points. Grouped data from bar charts are already partitioned as presented in the data source, so the steps outlined for using Sturges Rule will not apply: however, the number of cells can be checked.
- Range (R)=maximum value minus the minimum value.
- Cell width (W)=R/K.
The number of c...
Table of contents
- COVER PAGE
- TITLE PAGE
- COPYRIGHT PAGE
- MECHANICAL ENGINEERING
- PREFACE
- LIST OF SYMBOLS
- 1: DATA REDUCTION
- 2: APPLICATION OF PROBABILITY TO MECHANICAL DESIGN
- 3: OPTIMUM DESIGN
- 4: RELIABILITY
- APPENDIX A: LINEARIZATION OF THE WEIBULL EQUATION
- APPENDIX B: MONTE CARLO CALCULATIONS
- APPENDIX C: COMPUTER OPTIMIZATION ROUTINES [3.20]
- APPENDIX D: MECHANICAL FAILURE RATES FOR NON-ELECTRONIC RELIABILITY
- APPENDIX E: STATISTICAL TABLES
- APPENDIX F: LOS ANGELES RAINFALL 1877–1997
- APPENDIX G: SOFTWARE CONSIDERATIONS
Frequently asked questions
Yes, you can cancel anytime from the Subscription tab in your account settings on the Perlego website. Your subscription will stay active until the end of your current billing period. Learn how to cancel your subscription
No, books cannot be downloaded as external files, such as PDFs, for use outside of Perlego. However, you can download books within the Perlego app for offline reading on mobile or tablet. Learn how to download books offline
Perlego offers two plans: Essential and Complete
- Essential is ideal for learners and professionals who enjoy exploring a wide range of subjects. Access the Essential Library with 800,000+ trusted titles and best-sellers across business, personal growth, and the humanities. Includes unlimited reading time and Standard Read Aloud voice.
- Complete: Perfect for advanced learners and researchers needing full, unrestricted access. Unlock 1.4M+ books across hundreds of subjects, including academic and specialized titles. The Complete Plan also includes advanced features like Premium Read Aloud and Research Assistant.
We are an online textbook subscription service, where you can get access to an entire online library for less than the price of a single book per month. With over 1 million books across 990+ topics, we’ve got you covered! Learn about our mission
Look out for the read-aloud symbol on your next book to see if you can listen to it. The read-aloud tool reads text aloud for you, highlighting the text as it is being read. You can pause it, speed it up and slow it down. Learn more about Read Aloud
Yes! You can use the Perlego app on both iOS and Android devices to read anytime, anywhere — even offline. Perfect for commutes or when you’re on the go.
Please note we cannot support devices running on iOS 13 and Android 7 or earlier. Learn more about using the app
Please note we cannot support devices running on iOS 13 and Android 7 or earlier. Learn more about using the app
Yes, you can access Probability Applications in Mechanical Design by Franklin Fisher in PDF and/or ePUB format, as well as other popular books in Physical Sciences & Civil Engineering. We have over one million books available in our catalogue for you to explore.