- 99 pages
- English
- ePUB (mobile friendly)
- Available on iOS & Android
eBook - ePub
An Introduction to Signal Processing for Non-Engineers
About this book
This book introduces the basic concepts of signal processing for scientists and students with no engineering background. The book presents the concepts with minimum use of mathematical formulations and more emphasis on visual illustrations. The idea is to present an intuitive approach to understanding the basics of signal processing and exemplify some practical applications of the concepts by which the readers achieve basic knowledge and skills in signal processing. Most of illustrations in the book have been created by computer programming in MATLAB®; thus, the reader will learn the basics of using computers in signal processing applications.
Tools to learn more effectively

Saving Books

Keyword Search

Annotating Text

Listen to it instead
Information
1 Introduction
This book is not going to be a comprehensive reference for a signal processing course; however, it does present basic concepts discussed in almost all signal processing books. I put my emphasis on an intuitive understanding of what these concepts are about and show some examples of how they are being used in the scientific literature. I try to refrain from presenting mathematical formulations as much as possible; however, to get a good grasp of the concepts, some understanding of the math behind the topic is crucial; therefore, I have tried to keep it to a minimum level. I present some MATLAB1 sample codes to make a case for the application of the concepts. MATLAB is a licensed software package, which may not be available for all readers of this book; in case readers do not have access to a license for MATLAB, I suggest using Octave,2 whose syntax is largely compatible with MATLAB. However, I test all my sample codes in MATLAB and cannot guarantee that they are all translatable to Octave without any modification. I briefly introduce MATLAB in Appendix A.1, but I also encourage the reader to take advantage of the huge number of available online resources (mainly from MathWorks) providing instruction in MATLAB programming.
1.1 Why Do We Need to Introduce the Theories of Signal Processing to Non-Engineers?
Like any field of science, signal processing and its rapid development are intertwined with the developments of other fields of technology and science. Modern signal processing technology emerged during the World Wars I and II, when scientists and engineers were dealing with radar and sonar signals and wanted to extract the signal from the background noise (Stillwell, 2013). The development of computers and the introduction of the digital world to various fields of technology, as well as the invention of new sensors enabling measurements of a wide range of physical quantities, allows signal processing to appear in various disciplines. It is obviously exciting to acquire objective measurements of a phenomenon under investigation, but this comes at a price, in that scientists have to deal with some sort of a signal and signal processing methods in their work. Thus, today signal processing appears in many scientific articles and in the methodological sections of the articles in one way or another. For example, I simply searched for two keywords, “EMG” which stands for electromyography and “sport” in the web of science.3 The number of publications with these two keywords has increased markedly since 1994 (Figure 1.1).
Although sport science is a very broad field and many scientists in this field may have an engineering background, it is generally not known to be a branch of engineering science, and many scientists in this field do not necessarily have any engineering background. The EMG is a typical biological signal, and the aforementioned articles must inevitably address how EMG signals have been sampled, filtered and analyzed. All of these points have close ties to the theory of signal processing. If I repeat the same search with physiotherapy as the topic, a marked increase in publications from 1992 can be seen here too, but maybe not to the same extent as I could see for sport science. Obviously, this simple search does not qualify a scientific survey; nevertheless, it may be an indication of the widespread use of signal processing in various fields that are not necessarily known as branches of engineering science. A lack of basic knowledge in this field may cause fallacious interpretation of the results obtained in a scientific investigation. Therefore, gaining a basic knowledge of signal processing for non-engineers turns out to be very important.
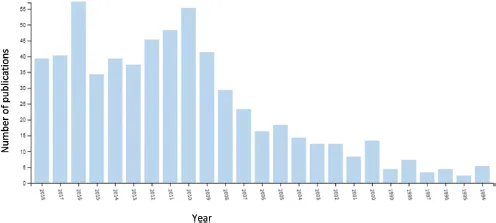
Figure 1.1The number of publications with the keywords EMG and sport over the years
1.2 What Is a Signal?
If one looks up the word in the Merriam-Webster dictionary,4 there will be one definition that is very close to what is implied by a signal in the theory of signal processing, “a detectable physical quantity or impulse (such as a voltage, current, or magnetic field strength) by which messages or information can be transmitted”. There is one very important keyword in this definition, and that is “information”. However, a signal does not necessarily need to be a physical quantity; for example, a financial time series may contain the rating of a stock market over a certain period of time. Having said that, most often we deal with some sort of physical quantity in signal processing.
As mentioned earlier, “information” is the key word, as it provides the content of communication between humans or between humans and machines. Here, the term “machine” is being used in a broad context in which even the human body is a machine. For example, when we record biological signals (e.g., EMG) and process them, we essentially extract desired information from the complex machine of the human body.
1.3 What Is Noise?
When capturing signals in practical applications, what we acquire is not purely the signal (what we are interested in). There will be an undesired part that contaminates our signal and therefore is undesirable. This undesirable part is called “noise”. Knowing the relationship between what we acquire, signal and noise is crucial to effectively remove the noise and keep the signal. For example, if one is interested in studying the level of muscle activity during a specific physical activity, the interference from the power line to the measured signal is not of interest, and therefore that interference is a part of the noise.
In many applications, a simple additive relationship is not quite far from reality, and very often this model is assumed to describe the relationship between what we measured (m), signal (s) and noise (n).
Thus, we may have:
This is called a model of an “additive noise”, meaning that the noise is simply added to the signal, and the measurement is simply the summation of the noise and the signal. However, in a general case, the relationship between signal and noise can be more complex, and the measurement can be an unknown function of the signal and noise. In an experimental design, special precautions are taken such that the noise is as minimal as possible, and an additive model of noise could be often assumed.
In certain cases, even though the noise model is not essentially additive, using a little mathematical trickery, an equivalent additive noise model can be found. For example, if m = s.n (m equals s times n), the noise is productive, but if we simply take the logarithm of both sides of the equation, this case can be a transformed into an additive noise model as logm = logs + logn.
The quality of the measurement refers to a question about how big the noise term in the equation is with respect to the signal term. In technical documents and papers, one may come across a term called signal-to-noise ratio (SNR), which simply carries this piece of information about the magnitude of a signal with respect to the noise. In physics, this is expressed in terms of the ratio between the power of the signal and noise, and because the range of signal and noise power can be quite wide, a logarithmic scale is used. The power of the signal and noise implies how much energy in a unit of time is being transferred by the signal and noise.
Thus:
As the signal and noise are often measured in voltage or current, it may seem more convenient to express the SNR in terms of the magnitude of voltage or current. If one remembers the basic physics of electrical circuits—for example, for a resistor—the power is proportional to the square of voltage across the resistor or the current passing through it. Thus, if the SNR is calculated in terms of voltage or current amplitude, one can write:
This relative index is expressed in decibels (db) and because, in a general case, the current or the voltage varies across time, the amplitude is calculated in terms of the root mean square (RMS). RMS of a signal in a limited time window is calculated by taking the average of the samples of the signal to the power of 2 and then taking the square root of the average.
Table of contents
- Cover
- Half Title
- Title
- Copyright
- Contents
- Preface
- Acknowledgments
- Author
- Chapter 1 Introduction
- Chapter 2 The Measurement Pipeline
- Chapter 3 Time and Frequency Representation of Continuous Time Signals
- Chapter 4 Sampling of Continuous Time Signals
- Chapter 5 Discrete Fourier Transform
- Chapter 6 Power Spectrum
- Chapter 7 Systems and Their Properties
- Chapter 8 Filters
- Appendix A.1: A Brief Introduction to MATLAB
- Appendix A.2: Complex Numbers
- Appendix A.3: An Introduction to Convolution
- Appendix A.4: Correlation
- Index
Frequently asked questions
Yes, you can cancel anytime from the Subscription tab in your account settings on the Perlego website. Your subscription will stay active until the end of your current billing period. Learn how to cancel your subscription
No, books cannot be downloaded as external files, such as PDFs, for use outside of Perlego. However, you can download books within the Perlego app for offline reading on mobile or tablet. Learn how to download books offline
Perlego offers two plans: Essential and Complete
- Essential is ideal for learners and professionals who enjoy exploring a wide range of subjects. Access the Essential Library with 800,000+ trusted titles and best-sellers across business, personal growth, and the humanities. Includes unlimited reading time and Standard Read Aloud voice.
- Complete: Perfect for advanced learners and researchers needing full, unrestricted access. Unlock 1.4M+ books across hundreds of subjects, including academic and specialized titles. The Complete Plan also includes advanced features like Premium Read Aloud and Research Assistant.
We are an online textbook subscription service, where you can get access to an entire online library for less than the price of a single book per month. With over 1 million books across 990+ topics, we’ve got you covered! Learn about our mission
Look out for the read-aloud symbol on your next book to see if you can listen to it. The read-aloud tool reads text aloud for you, highlighting the text as it is being read. You can pause it, speed it up and slow it down. Learn more about Read Aloud
Yes! You can use the Perlego app on both iOS and Android devices to read anytime, anywhere — even offline. Perfect for commutes or when you’re on the go.
Please note we cannot support devices running on iOS 13 and Android 7 or earlier. Learn more about using the app
Please note we cannot support devices running on iOS 13 and Android 7 or earlier. Learn more about using the app
Yes, you can access An Introduction to Signal Processing for Non-Engineers by Afshin Samani in PDF and/or ePUB format, as well as other popular books in Technology & Engineering & Electrical Engineering & Telecommunications. We have over one million books available in our catalogue for you to explore.