- 348 pages
- English
- ePUB (mobile friendly)
- Available on iOS & Android
eBook - ePub
Data Mining for Bioinformatics
About this book
Covering theory, algorithms, and methodologies, as well as data mining technologies, Data Mining for Bioinformatics provides a comprehensive discussion of data-intensive computations used in data mining with applications in bioinformatics. It supplies a broad, yet in-depth, overview of the application domains of data mining for bioinformatics to he
Tools to learn more effectively

Saving Books

Keyword Search

Annotating Text

Listen to it instead
Information
IVSUPERVISED LEARNING AND VALIDATION
Chapter 8
Classification Techniques in Bioinformatics
Supervised learning, like unsupervised learning, is one of the data mining tasks introduced in the knowledge discovery in databases (KDD) process and consists of two phases, training and testing. In the training phase, we build a model using samples that is representative of the hypothesis (or real-world use of the function) and connects (learns from) the input parameters to achieve a learning objective, such that the samples can accurately and efficiently predict the learning outcome. We then extract features of interest from the samples. In this step, we ensure that the features are not too large in order to avoid the curse of dimensionality. Once we have completed the training phase, we begin the test phase. We test the trained model using random samples of data. Typically, the test phase includes evaluation routines such as holdout and k-fold cross-validation techniques. In this chapter we provide an overview of the various supervised learning techniques, better known as classification techniques, and their application in the field of bioinformatics.
8.1 Introduction
There is a wide variety of classification techniques that one can choose from, and they perform differently under different data and learning domains. It is important to understand how these algorithms work in order to understand how the performances and results will differ. Before we explain the working principle of each algorithm, we will highlight the intricacies of supervised learning.
8.1.1 Bias-Variance Trade-Off in Supervised Learning
When trying to understand how a supervised learning algorithm works, it is imperative to understand two key terms, bias and variance. To elucidate the effects of bias and variance and help define their prominence in supervised learning, let us first consider a situation in which we have two train sets. Let us assume that these two train sets do not share any samples but have the same number of classes and the same number of samples in each class. Let us consider a random test sample x that is used to test models built by a supervised learning algorithm using both training sets independently. If the sample x is incorrectly classified across both train sets, the model has a high degree of bias. If however, sample x is assigned a different class for different train sets, then the model has a high degree of variance. These two variables have direct implications on the prediction error of the model, as it is directly proportional to the sum of the bias and variance.
When we create a train set with low bias, the result is often a “flexible classifier.” However, such a classifier may be too flexible and will fit differently in different datasets. Thus, there is a natural trade-off between bias and variance.
8.1.2 Linear and Nonlinear Classifiers
In this section we draw the distinction between linear and nonlinear classifiers. The distinction is drawn by how the input object’s characteristics are modeled for decision making.
A linear classifier decides class membership of a sample by comparing a linear combination of the features to a fixed threshold. For example, let us consider a set of points that belong to two classes represented in a two-dimensional (2D) space as shown in Figure 8.1. A linear classifier attempts to fit a line c1f1 + c2f2 = H so that the line separates or divides the points into two corresponding classes. This step is best described in Figure 8.1(a). Since we consider only two features f1 and f2 for analysis, the resultant rules for classification are a linear combination of these two features, in which a sample is assigned to the first class if it satisfies c1f1 + c2 f2 > H. Otherwise, the feature is assigned to the second class.
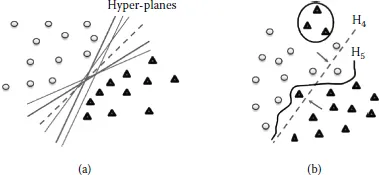
Figure 8.1 The triangles and dots can be separated by multiple linear classifiers in (a). In some cases, the separation of data by a linear function can lead to false alarms (and dismissals) in discrimination, but a nonlinear function can achieve better separation, as shown in (b).
In our example, (f1, f2)T is the 2D vector representation of a data point. Both the parameter vector (c1, c2)T and the constant H play a vital role in defining the decision boundary. The resultant 2D representation of the decision boundary is a straight line that is a plane when viewed in three dimensions. When the number of dimensions is greater than 3, the resultant decision boundary is generalized to what is referred to as a hyperplane. If a hyperplane perfectly separates two classes, then the two classes are linearly separable. It should be noted that if the property of linear separability is maintained, then there are an infinite number of linear separators. Figure 8.1(a) is pictorial representation of a scenario in which the number of possible hyperplanes can be infinite. In reality, data are plagued by noise. While dealing with a linearly separable problem using noisy data for training, the challenge of choosing the best hyperplane is questioned, requiring a stringent criterion for selecting among all decision hyperplanes that perfectly separate the training data. In general, some hyperplane will perform well on new data and some will not. Thus, linear classif...
Table of contents
- Cover
- Half Title
- Title Page
- Copyright Page
- Table of Contents
- Preface
- About the Authors
- Section I
- Section II
- Section III
- Section IV
- Index
Frequently asked questions
Yes, you can cancel anytime from the Subscription tab in your account settings on the Perlego website. Your subscription will stay active until the end of your current billing period. Learn how to cancel your subscription
No, books cannot be downloaded as external files, such as PDFs, for use outside of Perlego. However, you can download books within the Perlego app for offline reading on mobile or tablet. Learn how to download books offline
Perlego offers two plans: Essential and Complete
- Essential is ideal for learners and professionals who enjoy exploring a wide range of subjects. Access the Essential Library with 800,000+ trusted titles and best-sellers across business, personal growth, and the humanities. Includes unlimited reading time and Standard Read Aloud voice.
- Complete: Perfect for advanced learners and researchers needing full, unrestricted access. Unlock 1.4M+ books across hundreds of subjects, including academic and specialized titles. The Complete Plan also includes advanced features like Premium Read Aloud and Research Assistant.
We are an online textbook subscription service, where you can get access to an entire online library for less than the price of a single book per month. With over 1 million books across 990+ topics, we’ve got you covered! Learn about our mission
Look out for the read-aloud symbol on your next book to see if you can listen to it. The read-aloud tool reads text aloud for you, highlighting the text as it is being read. You can pause it, speed it up and slow it down. Learn more about Read Aloud
Yes! You can use the Perlego app on both iOS and Android devices to read anytime, anywhere — even offline. Perfect for commutes or when you’re on the go.
Please note we cannot support devices running on iOS 13 and Android 7 or earlier. Learn more about using the app
Please note we cannot support devices running on iOS 13 and Android 7 or earlier. Learn more about using the app
Yes, you can access Data Mining for Bioinformatics by Sumeet Dua,Pradeep Chowriappa in PDF and/or ePUB format, as well as other popular books in Computer Science & Data Mining. We have over one million books available in our catalogue for you to explore.