
- 352 pages
- English
- ePUB (mobile friendly)
- Available on iOS & Android
eBook - ePub
About this book
The first text designed specifically with clinical practitioners in mind, Functional Neuroimaging demonstrates the clinical application and utilization of functional neuroradiology for early diagnosis, neurological decision-making, and assessing response to cancer therapy. Edited by the Founding President of American Society of Functional Neuroradi
Tools to learn more effectively

Saving Books

Keyword Search

Annotating Text

Listen to it instead
Information
1
Physical Principles of BOLD fMRI—What Is Important for the Clinician
The Neuroradiology Section and the Functional MRI Laboratory, Department of Radiology, Memorial Sloan-Kettering Cancer Center, New York, New York, U.S.A.
INTRODUCTION
In order to correctly interpret clinical blood oxygenation-level dependent (BOLD) functional magnetic resonance imaging (fMRI) studies, it is essential to appreciate the MRI physics of this technique. There are many books with thorough descriptions of the complicated physical principles of fMRI; however, in the present chapter, we hope to describe these important physical concepts in language geared toward clinicians. Readers who wish to know more about this broad subject are referred to the books: 1 to 6 in references.
THE MRI MAGNET
To obtain good quality fMRI studies it is necessary to use a superconductive magnet (usually at 1.5 or 3 T) with high-field homogeneity. The higher the magnetic field strength, the better the magnet is for fMRI studies, since the BOLD fMRI signal increases as the square of the difference in field strength. Therefore, a 3-T magnet will produce an fMRI BOLD signal approximately four times greater than a 1.5-T system.
Before obtaining an fMRI scan on a patient, the magnetic field must be adjusted (or “shimmed”) to obtain as uniform a magnetic field as possible. Likewise, the gain of the transmitter and receiver in the MRI scanner must be optimized. In contemporary scanners of most manufacturers, this can be accomplished by the auto pre-scan mode.
MRI CONTRAST MECHANISMS
The three major tissue contrast mechanisms important for our discussion of BOLD fMRI are T1, T2, and T2*. T1 is the longitudinal relaxation time or spin-lattice relaxation time, caused by the interaction between the spin and its environment. T2 is the transverse relaxation time or spin-spin relaxation time in a homogeneous local magnetic field, caused by the interaction between the spin and other nearby spins. T2* is the transverse relaxation time or spin-spin relaxation time in a nonhomogeneous local magnetic field. Usually T1- and T2-weighted images are used for anatomical studies, i.e., displaying tissue and/or tumor structures in the brain. T2*-weighted images are used in BOLD fMRI to investigate brain function.
The raw data for generating T1- and T2-weighted images are usually acquired using a spin echo (SE) pulse sequence. There are two RF pulses in the SE pulse sequence. The first one, with a flip angle of 90°, is an excitation pulse used for transverse magnetization and the second (180°) is a refocusing pulse to reverse the spin phase and generate the SE.
T2*-weighted images are usually obtained using a gradient echo (GE) pulse sequence. A GE pulse sequence has only one RF pulse with a flip angle (a) for excitation of the signal and uses gradient pulses to refocus the spin phase and generate an echo (i.e., “gradient echo”).
For our purposes, the main difference between the SE sequences (usually used to acquire T1 and T2) and the GE sequence (usually used to acquire T2*) is that the GE sequence is much more affected by local field inhomogeneities. T2* depends not only on the inherent T2 of the tissues but also on the additional relaxation time resulting from an inhomogeneous local magnetic field. Local magnetic field inhomogeneities can be generated by many things, including metal, blood products, and air-tissue interface. Since the SE sequences have a refocusing pulse, they are less affected by local field inhomogeneities, whereas the lack of a refocusing pulse on the GE sequences causes the artifacts created by the field inhomogeneities to become more prominent or to “bloom” (Fig. 1). Usually, such artifacts are a nuisance (for example, artifacts caused by dental work) and MRI sequences are optimized to minimize their effect; however, the BOLD fMRI sequence, on the other hand, will actually use the local field inhomogeneities caused by the different states of hemoglobin to create images of brain function (Fig. 2).
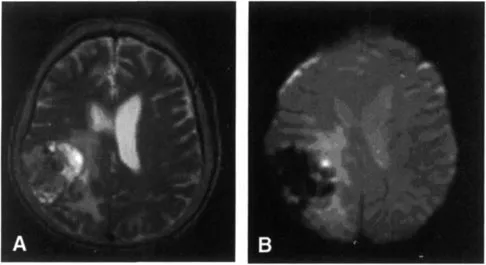
Figure 1 (A) SE T2-weighted images (TR/TE/flip angle = 3800 ms/102 ms/90°) from a 3-T scanner for a patient with a tumor in the right parietal lobe. (B) GE T2*-weighted images (TR/TE/flip angle = 4000 ms/30 ms/90°) of the same patient. The main difference between the two images is that there is a large signal dropout on the T2* sequence in the area of the tumor. This is caused by small local field inhomogeneities in the tumor caused by microcalcifications and small hemorrhages. The SE sequence is less sensitive to these small local field inhomogeneities. Therefore, the tumor exhibits signal intensity close to that of the normal brain. However, the T2* sequence is very sensitive to these local field inhomogeneities, which causes rapid spin-spin relaxation and a prominent dropout in signal.

Figure 2 The physical basis for BOLD fMRI. T2* decay curves show that the signal (S) will vary according to the presence or absence of field inhomogeneities. At time = TE, the signal intensity (S) is different. The presence of field inhomogeneities causes the signal to drop (arrow). BOLD fMRI uses this principle since deoxygenated hemoglobin is paramagnetic and causes a much large signal dropout than oxygenated hemoglobin. Hence a relative increase of dHb concentration in blood leads to a magnetic susceptibility effect and a dropout in T2* signal.
T2* AND BOLD fMRI Signal
One physiological source that strongly influences the T2* value in a human brain is hemoglobin (Hb), especially, the difference between oxygenated hemoglobin (HbO2) and deoxygenated hemoglobin (dHb) in blood. dHb has a paramagnetic species of iron due to the four unpaired electrons, which produces a large magnetic susceptibility effect. On the other hand, HbO2 is a diamagnetic molecule with a small magnetic susceptibility effect. Hence a relative increase of dHb concentration in blood leads to a corresponding increase in the distortion of the local magnetic field due to the magnetic susceptibility effect. Therefore, the protons in or next to the blood in veins and capillaries with high dHb content lose the coherent phase faster, making the T2* value shorter and leading to a dropout of signal. Therefore, employment of a T2* sequence will serve to highlight the difference between dHb and HbO2.
Ogawa et al. in 1990 (7, 8, 9) published three papers on fMRI based on the change of dHb concentration in the veins due to brain neuronal activity. Although the first fMRI of human brain, described by Belliveau et al. in 1991 (10), used an exogenous gadolinium-based contrast agent, this technique was rapidly superseded by the method from Ogawa who used the dHb molecule as an endogenous contrast agent for brain functional imaging. Ogawa’s results showed that the observed T2* change through the microvascular MR signal was linked to the presence of blood deoxygenation and that relative changes in dHb cause a “blood oxygen-level dependent” or a “BOLD” effect.
The sensitivity of BOLD contrast allows fMRI to be performed in an individual subject with temporal resolution on the order of a second and spatial resolution of 2 mm or less in almost all cortical structures of a human brain. Since current BOLD fMRI technology can indirectly measure neuronal activity in real time, it is capable of noninvasive investigation of functional attributes of the brain while performing a certain task. The BOLD fMRI has developed to become one of dominated methods for functional brain imaging.
HOW BOLD fMRI IS DIFFERENT FROM ROUTINE MR IMAGING SEQUENCES
It is important to understand that the way that one acquires images for BOLD fMRI differs from routine MRI sequences (such as T1, T2, and FLAIR) in a number of fundamental ways. First, routine brain imaging sequences typically take a number of minutes to acquire. This allows one to acquire high-resolution images of the brain, generally with a matrix of 256 × 256 or higher. On the other hand, for BOLD fMRI one is not so much interested in spatial resolution, rather the goal of BOLD is to measure the changes in signal intensity in each voxel over short periods. In order to accomplish this, one needs to scan the entire brain (or at least the area of the brain in which one is interested) multiple times with the time of each acquisition being on the order of two to four seconds. To acquire images of the entire brain every few seconds, one is forced to use a very rapid technique (typically echo planar imaging, EPI) and to sacrifice resolution. Typically, fMRI images are acquired using a 64 × 64 or 128 × 128 matrix.
Second, when one acquires routine scans of the brain, one assumes that the signal intensity will not change over the time of acquisition. On the other hand, when acquiring BOLD data, one actually focuses on the small changes in signal intensity that occur in each voxel during the acquisition. Typically, one compares two different conditions, such as rest and finger tapping, which is known as a paradigm. The simplest functional paradigm is known as a “boxcar paradigm,” during which the subject or patient performs a task for a period of time and then rests for a period of time. This “on (= task period)” and “off (= rest period)” sequence is repeated a number of times. One then performs a statistical analysis of the data to determine if the change in signal intensity correlates to the paradigm.
WHY DOES THE MR SIGNAL CHANGE WITH AN INCREASE IN NEURONAL ACTIVITY?
The main idea behind BOLD fMRI is that when there is an increase in neuronal activity in a part of the brain, that part will show a change in signal intensity that can be detected by MRI. Neuronal activity is associated with many complex physiological processes in which metabolic byproducts, cerebral blood flow (CBF), cerebral blood volume (CBV), cerebral metabolic rate of oxygen (CMRO2), and blood oxygenation all combine to create the BOLD effect in fMRI.
The change over time in the BOLD fMRI signal intensity that one observes can be termed the hemodynamic response, and mathematical models of the response are called the hemodynamic response function (HDRF). In-depth basic science work has led to the establishment of a quantitative model relating the BOLD signal to CBF, CBV, and CMRO2. Understanding how these three parameters interplay to create the HDRF will allow one to appreciate how the BOLD signal produced as well as to understand how the BOLD signal is modified in pathological conditions. The standard model to explain the HDRF was developed by Buxton et al. (11) and is known as the “Balloon Model.”
Essentially what occurs is that an increase in neuronal activity leads to two processes. First, there is an increase in the local metabolic rate of oxygen (CMRO2) that leads to an increase in oxygen extraction. This, in turn, leads to an increase in deoxyhemoglobin (dHb), which is paramagnetic. Such an increase in paramagnetic deoxyhemoglobin (had it been the only process to occur) would have led to a drop in fMRI signal intensity since the presence of a paramagnetic substance causes more rapid T2* dephasing and a drop in signal intensity. However, neuronal activity also causes a concomitant increase in blood flow (CBF), which actually overshoots the increased demand for oxygen. This overshoot leads to an influx of oxygenated blood, an increase in oxyhemoglobin (HbO2) over and above the decrease in oxyhemoglobin caused by oxygen extraction and a consequential dilution of deoxyhemoglobin. Since there is now less paramagnetic deoxyhemoglobin, there is less dephasing of the T2* signal and a consequential increase in fMRI signal (Fig. 3).
The reason for the overshoot in blood flow (CBF) is unclear. Some recent results have suggested that the increase in CBF following neural activity is not because of the metabolic demands of the brain region, but rather is driven by the presence of neurotransmitters, especially glutamate (12,13).
The image intensity for a given voxel in the brain can therefore significantly increase if more oxygenated blood enters this region and fills the venous bed. This assumes, however, that cortical activation causes local vasodilation and an increase in CBF. If there is no increase in the CBF due to an increase in neuronal activity, the changes in oxygen consumption may lead to no change or even a decrease in BOLD fMRI signal intensity.
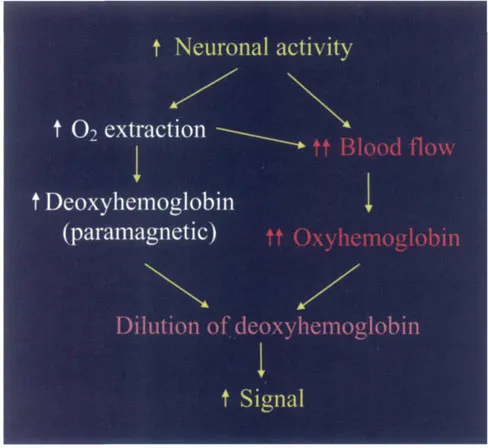
Figure 3 A schematic that illustrates why there is an increase i...
Table of contents
- Cover
- Half Title
- Title Page
- Copyright Page
- Dedication
- Table of Contents
- Preface
- Contributors
- 1. Physical Principles of BOLD fMRI—What Is Important for the Clinician
- 2. Preparing the Patient for the fMRI Study and Optimization of Paradigm Selection and Delivery
- 3. Methods of Analysis
- 4. Fact or Artifact?
- 5. Language
- 6. Vision and Higher Cortical Function
- 7. Cortical Plasticity
- 8. Functional Image-Guided Neurosurgery
- 9. Development and Developmental Disorders
- 10. Neurodegenerative Disorders
- 11. Diffusion Imaging and Tensor Physics for the Clinician
- 12. Diffusion-Weighted Imaging in Stroke
- 13. Diffusion Imaging in Brain Tumors and Treatment Response
- 14. DTI of Developmental and Pediatric Disorders
- 15. DTI of Neurodegenerative Disorders
- 16. Perfusion Imaging
- 17. Perfusion Imaging: Physical Principles and Applications in the Brain
- 18. Magnetoencephalography
- Index
Frequently asked questions
Yes, you can cancel anytime from the Subscription tab in your account settings on the Perlego website. Your subscription will stay active until the end of your current billing period. Learn how to cancel your subscription
No, books cannot be downloaded as external files, such as PDFs, for use outside of Perlego. However, you can download books within the Perlego app for offline reading on mobile or tablet. Learn how to download books offline
Perlego offers two plans: Essential and Complete
- Essential is ideal for learners and professionals who enjoy exploring a wide range of subjects. Access the Essential Library with 800,000+ trusted titles and best-sellers across business, personal growth, and the humanities. Includes unlimited reading time and Standard Read Aloud voice.
- Complete: Perfect for advanced learners and researchers needing full, unrestricted access. Unlock 1.4M+ books across hundreds of subjects, including academic and specialized titles. The Complete Plan also includes advanced features like Premium Read Aloud and Research Assistant.
We are an online textbook subscription service, where you can get access to an entire online library for less than the price of a single book per month. With over 1 million books across 990+ topics, we’ve got you covered! Learn about our mission
Look out for the read-aloud symbol on your next book to see if you can listen to it. The read-aloud tool reads text aloud for you, highlighting the text as it is being read. You can pause it, speed it up and slow it down. Learn more about Read Aloud
Yes! You can use the Perlego app on both iOS and Android devices to read anytime, anywhere — even offline. Perfect for commutes or when you’re on the go.
Please note we cannot support devices running on iOS 13 and Android 7 or earlier. Learn more about using the app
Please note we cannot support devices running on iOS 13 and Android 7 or earlier. Learn more about using the app
Yes, you can access Functional Neuroimaging by Andrei I. Holodny in PDF and/or ePUB format, as well as other popular books in Medicine & Neurology. We have over one million books available in our catalogue for you to explore.