- 328 pages
- English
- ePUB (mobile friendly)
- Available on iOS & Android
eBook - ePub
Measuring Gene Expression
About this book
In the post-genomic age, much biomedical research looks at when, where, and at what level genes are expressed. Measuring Gene Expression is an all-in-one introduction to the main methods of measuring gene expression, including RT-PCR, differential display, RNA interference, reporter genes, microarrays, and proteomics, as well as a section on RNA isolation and analysis. There is an overview of each method: its pros and cons, sample preparation, sources of error, and data interpretation.
Tools to learn more effectively

Saving Books

Keyword Search

Annotating Text

Listen to it instead
Information
1
Gene expression and its control
1.1 Introduction
What makes a cell act and look a certain way? Why do two cells express different phenotypes? When talking about two different individuals, one might start by highlighting differences between the complements of genes present in each. In bacteria, such differences are very pronounced. The presence of mobile DNA elements, with ‘plug-and-play’ attributes, seemingly randomly scattered amongst members of a population provide phenotypic variation to the population as a whole (Avison and Bennett, 2005). Smaller genetic variation, caused by point mutations, deletions and duplications are found in populations of bacteria and eukaryotic organisms alike. Mutations within coding sequences can alter, or even destroy the activity of the protein produced, and many examples of phenotypic variation caused by such mutations are known in our own species. Most help give us a wonderfully varied society; some cause terrible genetic disease (Avison and Bennett, 2005; Crow, 2000).
Phenotypic variation is not just about differences in functional gene complement, though. Normally the genotypes of, for example, brain and liver cells from the same individual are identical, and yet their phenotypes are remarkably different. Similarly, bacterial cells can express strikingly diverse phenotypes dependent upon the environmental conditions in which they find themselves. To explain this, one must look away from the physical makeup of a genotype and instead, consider its expression. The study of how a genotype produces a phenotype is widely referred to as functional genomics, and with the current availability of huge amounts of genome sequence information, this is a real growth industry. Functional genomics represents a massive field of study encompassing classical and molecular genetics (knocking genes out and over-expressing them in order to learn more about the functions they encode), structural genomics (systematically over-expressing and purifying recombinant proteins to see what they look like) and studies on gene expression (find out when a gene is expressed and you might learn more about the function it encodes). An important part of this last facet of functional genomics is the methodology associated with measuring gene expression, and this is where this book aims to help.
A quip, uttered by many embittered practitioners of functional genomics is that you only know you’ve made it in this business if you coin a new ‘ome’. An ‘ome of your own’, if you will. There are many weird and wonderful omes: ‘metabolome’ (the sum of the metabolic pathways working in a cell at any one time) and ‘regulonome’ (the sum of all the transcriptional regulatory pathways working in a cell at any one time) for example, but the three omes you need to understand for this book are ‘genome’ (obvious, the sum total of genes in a cell), ‘transcriptome’ (the sum total of RNA molecules produced at any one time in a cell) and ‘proteome’ (the sum total of proteins produced at any one time in a cell). Analysis of genomic complement is the job of comparative genomics experts and that book is for another time. In this book, we will concentrate on measuring the transcriptome and proteome of a cell, or any subdivision of each. Don’t forget, though, that since many genes encode proteins whose roles are to regulate the expression of other genes, there is clearly an interrelation between genotype and gene expression. Changes in gene expression do not solely result as responses to external stimuli; they can occur due to mutation at regulatory loci. For example, loss of function mutations in transcriptional repressor genes will lead to constitutive over-expression of genes upon which the encoded repressor protein would normally act. Indeed, a very significant reason for measuring gene expression is as part of a series of experiments aimed at characterizing a gene expression regulatory function. For example, you might simply be interested in proving that a known regulatory system controls the expression of a test gene or group of genes; this would probably involve introduction of mutations into a cell, which constitutively activate or repress the regulatory mechanism, and measurements of expression levels for each test gene. Alternatively, you might be interested in which genes have their expression controlled by a poorly characterized regulator; again, you would probably mutate the regulator, but in this case, would take a global look at the effects on gene expression. Figure 1.1 illustrates an example regulatory system in Escherichia coli, the Mar regulon (Miller and Sulavik, 1996) and how measurements of gene expression have been used to characterize its function.
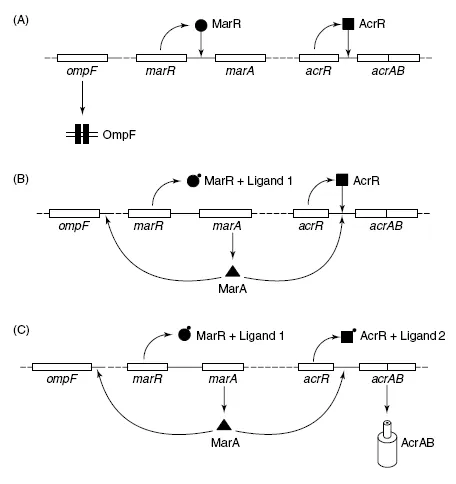
Figure 1.1
Complications in functional genomics illustrated by the Mar regulon. The multiple antimicrobial drug resistance (Mar) regulon consists of two transcriptional regulators, MarR and MarA. The gene ompF and the operon acrAB encode a porin, through which antimicrobial drugs enter the cell, and an efflux pump which exports antimicrobials, respectively. Transcription of acrAB is under repression from the local regulator, AcrR and is activated through MarA binding upstream. Transcription of ompF is repressed when MarA binds upstream. MarR is a repressor for transcription of marA. Thus in (A), MarR binds to the promoter for marA, and represses transcription. AcrR binds to the promoter for acrAB, and represses transcription. There is no MarA to repress ompF transcription. Antimicrobials could flow into the cell through OmpF, and there would be no AcrAB available to pump them out again. In (B) an inducing ligand binds to MarR, reporting the presence of a toxic compound within the cell (e.g. an antimicrobial drug). This causes a conformational change in MarR, and marA transcription becomes derepressed. MarA then blocks transcription of ompF, but cannot significantly activate transcription of acrAB, because AcrR is still bound at the promoter, and its repressive effect is dominant. In this state, further antimicrobial entry would be limited, but the antimicrobial already inside the cell will not be pumped out. In (C) a second regulatory ligand has built up sufficiently to bind to AcrR and de-repress acrAB transcription. However, in the absence of MarA, transcription of acrAB would be low. In this case, however, MarA is available to activate transcription of acrAB, causing active efflux of the antimicrobial present within the cell. This illustrates the idea of multiple signals linking into a regulatory pathway. It also illustrates some of the inherent problems of studying regulation of gene expression. A deletion of marR would cause OmpF production to stop, so it might be concluded that MarR is an activator of ompF expression. Furthermore, mutations lead to activation of MarR, and so production of MarA may not always lead to production of AcrAB, thus it may be missed that MarA regulates acrAB transcription. In this figure, part of the Mar regulon has been isolated. In truth, MarA also has an activatory ligand, and there are a number of other transcriptional regulators that can substitute for MarA functionally, but do so in response to different ligands, and their expression is controlled by multiple different upstream regulators. In eukaryotes, things are likely to be even more complex!
The other main reason for measuring gene expression is for pure ‘blue-sky’ functional genomics. You might be interested in which genes are expressed in a particular growth condition, as a fore-runner to hypothesizing what function a gene might encode. Alternatively, you might want to know which genes are differentially expressed in a diseased or differentiated cell, in order to predict which are the key functions in causing disease or differential phenotype.
You can probably think of many other possible experimental scenarios, but it doesn’t matter why you want to measure transcriptomic or proteomic complement, the same fundamental problems apply.
It is important that you realize from the start that the transcriptome and (to a lesser extent) the proteome are highly dynamic, and many of the methodological ‘hoops of fire’ you will have to jump through whilst measuring gene expression are primarily to make sure you catch an accurate picture of the ome as and when you want to take it, and that you minimize the introduction of omic artifacts (particularly those that you are unaware of) simply by doing the experiment a certain way. Even if you are very careful, however, I cannot guarantee that tried and tested methods will work for your particular cell type under your particular growth conditions. Sometimes, the ome does not keep still long enough for you to picture it and no matter how hard you bang your head on the desk, you will not be successful in taking a reliable picture. So, I have included advice concerning experimental design for each type of method, and how to check the statistical significance and reproducibility of the data you are generating, so that you might be better equipped to know when to give up and try something else.
Just because you think you have isolated a regulatory mechanism, and even have manipulated it specifically by mutation, the fact that the expression of a proposed target gene changes in the mutant does not prove that the target gene has its expression controlled directly by the regulatory mechanism. There is always a chance that your pet regulatory mechanism affects the activity of a secondary regulatory mechanism, and that this is the regulator of the target gene (Figure 1.1). Keep an open mind.
The ultimate ome when looking at a phenotype is the proteome. Who cares if a protein-coding gene is transcribed if the transcript never becomes translated? There are a number of studies where scientists have determined the transcriptome and proteome in parallel under the same growth conditions; in some they have obtained worryingly inconsistent results (e.g. Anderson and Seilhamer, 1997). Many people forget this, and because transcriptomics is methodologically more straightforward (and perhaps more easily automated) this is the predominant approach for measurement of global gene expression. Beware! For a gene to be truly expressed, a functionally active protein must be produced. Because it is often not possible to measure the amount of a particular protein in a cell, for example if it does not have an easily assayable activity, or if you do not have an antibody suitable for quantification of the protein, it is common to check for differential translation of a transcript flagged up by a transcriptomics experiment by fusing the gene to a reporter gene. These either encode an enzyme that is easily assayable, or a peptide tag whose concentration can be measured using a commercially available antibody. This is generally satisfactory, but be aware that the use of reporter genes is an artificial situation as set out in Chapter 6.
There are many other problems of biological and experimental variability particular to the individual methods for measuring gene expression, and these will be described in the various chapters of this book. The remainder of this chapter is aimed at explaining why the transcriptome and proteome are both so dynamic, by providing a brief overview of the myriad regulatory and mechanistic pathways involved in controlling the expression of a gene. This is a long way from a thorough explanation of gene expression and its control, however, and the reader should look elsewhere for more detailed examples that may be pertinent to their particular field of research.
1.2 An overview of the mechanics of transcription
Protein/DNA interactions
Transcription, and its control, is all about protein/DNA interactions. The conversion of DNA into an RNA transcript is a complex process, which needs to be timed correctly, and completed efficiently in order to correctly process the information content of DNA and ultimately express the phenotypes that it encodes.
DNA can be thought of as a whole lot of information coated in sugar and phosphate. The outer casing of deoxyribose sugar and tough phosphate backbone protects the information contained within the hydrogen-bonding potential of nitrogenous bases, and so secures this information content for generations to come. But all this protection poses the question: How can the cell access its own genetic information? Well the answer is through proteins that interact with the DNA and poke about through the cracks in the backbone to sense the sequence of bases below. The cracks are called the ‘major groove’ and ‘minor groove’, and into these grooves most DNA binding proteins fit their sensor regions. But in order to get close in the first place, DNA binding proteins need to be able to interact with the predominantly negatively charged phosphate backbone of DNA, and because of this, most DNA binding proteins have large, curved, positively charged surfaces, which allow the protein to fit snugly around the phosphate backbone. The positioning of the DNA binding protein allows the sensor region to fit into the major and/or minor groove, and interact with a number of bases, often through end face interactions with the ring structures that form a part of them, and sometimes indirectly with the hydrogen bonding network (Figure 1.2). Just as with the idea of an enzyme active site, these sensor regions have an amino acid sequence, which positions various critical chemical groups in such a way that if they happen to interact with a particular arrangement of bases, the result is a conformational change in the whole protein, and some output (Choo and Klug 1997; Harrison, 1991). The classical example of this would be a type II restriction enzyme, where the output would be cleavage of the phosphodiester bond at an appropriate position relative to the sequence of bases that the sensor region of the enzyme has evolved to recognize.
How DNA binding proteins find their correct target sites is not clear. Do they simply lock onto the DNA backbone and slide up and down constantly reading the sequence until they happen upon the appropriate target? Or do they work more like enzymes, and constantly collide with their substrate, hopping on and off the DNA, testing the nucleic acid sequence until a productive hit occurs? Or is it a mixture of the two? For the purposes of this book, however, the answer to this fascinating question (Halford and Marko, 2004) is not particularly important. What needs to be remembered is that particular proteins have domains that respond to particular nucleotide sequences, associating sequence specific DNA recognition with a variety of possible enzymatic functions. Alternatively, the DNA binding domains form part of proteins that simply provide a core for an enzyme complex to form around.
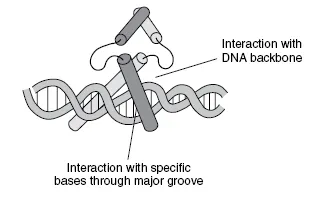
Figure 1.2
A helix-turn-helix protein binding to its DNA target. The figure shows a homo-dimer of helix-turn-helix transcription factors interacting with their target inverted repeat sequence through the major groove of DNA. The helices are represented as cylinders. Each turn of DNA is approximately 10–11 base pairs dependent upon the super-helical structure; the DNA binding region of each monomer interacts with a five-base-pair sequence. The two sequences are thus separated by five to six bases, putting them both in the same orientation with respect to the DNA. However, the two proteins point in opposite directions with respect to one another (i.e. they point away from each other in the figure) meaning that the sequences to which each binds are arranged in opposite orientations on (and so opposite strands of) the DNA. This would represent a typical inverted repeat. The dimerization domain is usually...
Table of contents
- Cover Page
- Title Page
- Copyright Page
- Abbreviations
- Preface
- 1. Gene Expression and Its Control
- 2. Isolation and Analysis of RNA
- Protocol 2.1: Isolation of RNA from Animal Cells Using the Acid Phenol Method
- Protocol 2.2: Isolation of RNA from Bacterial and Yeast Cells Using Guanidine Isothiocyanate and Lithium Chloride Precipitation
- Protocol 2.3: Isolation of RNA from Plant and Filamentous Fungal Cells By Using Guanidine Hydrochloride
- Protocol 2.4: Rapid Isolation of RNA from Animal Tissues and Cells Using Guanidine Isothiocyanate, Lithium Chloride and Cesium Trifluoroacetate Isopycnic Density Centrifugation
- Protocol 2.5: Separate Isolation of Cytoplasmic and Nuclear RNA from Tissue Culture Cells
- Protocol 2.6: Purification of RNA Using Silica Beads
- 3. Hybridization-Based Methods for Measuring Transcript Levels
- Protocol 3.1: Production of a DNA Probe
- Protocol 3.2: 5´ End-Labeling of Oligonucleotides
- Protocol 3.3: Synthesis of First-Strand cDNA
- Protocol 3.4: Synthesis of Second-Strand cDNA
- Protocol 3.5: Ligation of Linker Sequences to Blunt-Ended cDNA
- Protocol 3.6: RNA Production In Vitro for cDNA Amplification
- Protocol 3.7: Nuclear Run-Off Assay
- 4. PCR-Based Methods for Measuring Transcript Levels
- Protocol 4.1: PCR Amplification of a Specific cDNA Sequence
- Protocol 4.2: Single-Tube RT-PCR
- Protocol 4.3: PolyA Plus SIP-PCR
- Protocol 4.4: Virtual Northern Blot
- 5. Differential Display, Subtractive Hybridization, Amplification Suppression and SAGE Techniques for Measuring Gene Expression
- 6. Measuring Gene Expression Using Reporter Gene Assays
- Protocol 6.1: The Bradford Protein Assay
- Protocol 6.2: Simplified Assay of β-Galactosidase Activity
- 7. Analysis of the Proteome
- Protocol 7.1: ELISA Analysis
- Protocol 7.2: Cyanogen Bromide Cleavage of Insoluble Proteins
- 8. Statistical Analysis of Gene Expression Data
Frequently asked questions
Yes, you can cancel anytime from the Subscription tab in your account settings on the Perlego website. Your subscription will stay active until the end of your current billing period. Learn how to cancel your subscription
No, books cannot be downloaded as external files, such as PDFs, for use outside of Perlego. However, you can download books within the Perlego app for offline reading on mobile or tablet. Learn how to download books offline
Perlego offers two plans: Essential and Complete
- Essential is ideal for learners and professionals who enjoy exploring a wide range of subjects. Access the Essential Library with 800,000+ trusted titles and best-sellers across business, personal growth, and the humanities. Includes unlimited reading time and Standard Read Aloud voice.
- Complete: Perfect for advanced learners and researchers needing full, unrestricted access. Unlock 1.4M+ books across hundreds of subjects, including academic and specialized titles. The Complete Plan also includes advanced features like Premium Read Aloud and Research Assistant.
We are an online textbook subscription service, where you can get access to an entire online library for less than the price of a single book per month. With over 1 million books across 990+ topics, we’ve got you covered! Learn about our mission
Look out for the read-aloud symbol on your next book to see if you can listen to it. The read-aloud tool reads text aloud for you, highlighting the text as it is being read. You can pause it, speed it up and slow it down. Learn more about Read Aloud
Yes! You can use the Perlego app on both iOS and Android devices to read anytime, anywhere — even offline. Perfect for commutes or when you’re on the go.
Please note we cannot support devices running on iOS 13 and Android 7 or earlier. Learn more about using the app
Please note we cannot support devices running on iOS 13 and Android 7 or earlier. Learn more about using the app
Yes, you can access Measuring Gene Expression by Matthew Avison in PDF and/or ePUB format, as well as other popular books in Biological Sciences & Biology. We have over one million books available in our catalogue for you to explore.