The representation and measurement of change is a fundamental concern to practically all scientific disciplines. Unfortunately, the study of change is not as straightforward as many researchers would like. The researcher interested in demonstrating change in behavior over time must use a longitudinal research design. Such a design, whether true, quasi-, or nonexperimental, poses several unique problems because it involves variables with correlated observations. There is no single statistical procedure for the analysis of longitudinal data, as different research questions dictate different data structures and, thus, different statistical models and methods. Avariety of procedures has been developed to assist researchers in the analysis and quantification of change. Major analytic strategies for analyzing longitudinal data include autoregressive and growth curve models. These two approaches are, in general, quite different ways of modeling longitudinal data and can yield quite different results, although in some specific cases they are closely related. The choice of model depends on the nature of the phenomenon under study and the research question.
TYPICAL APPROACHES TO STUDYING CHANGE
Historically, the most prevalent type of longitudinal data in the behavioral and social sciences has been longitudinal panel data consisting of observations made on many individuals across pretest and posttest occasions. Longitudinal panel models have a number of important advantages over cross-sectional models. Probably the most important advantage is the correspondence between panel models and the commonly stated conditions for inferring a causal connection between two variables. Methodologists generally agree that inferring causality requires demonstrating that three conditions are met: (a) the presumed cause and effect are related, (b) the presumed cause precedes the effect in time, and (c) other competing explanations for the observed effect can be ruled out (Bollen, 1989; Kessler & Greenberg, 1981). The second condition can never be met with cross-sectional data. Gollob and Reichardt (1987) also argued that, because causes take time to exert their effects and cross-sectional models fail to include these time lags, such models are inherently misspecified.
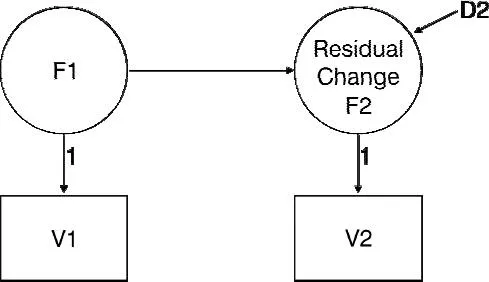
One traditional approach to studying change has been the use of an autoregressive or residual change model, such as that shown in Fig. 1.1. Gollob and Reichardt (1987) stated that the autoregressive effect (the effect of a Time 1 measure on the Time 2 measure of the same variable) is a legitimate competing explanation for an observed effect. Therefore, these authors have argued that time lags and autoregressive effects must be included in causal models before causal inferences can be made concerning the influence of additional predictor variables.
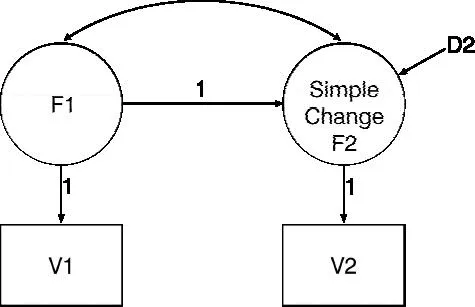
Other researchers have disputed the central role of autoregressive effects (residual change scores) and have focused instead on the simple difference score (see Fig. 1.2) or on the analysis of growth curves when data are collected on more than two occasions (Rogosa, Brandt, & Zimowski, 1982; Stoolmiller & Bank, 1995).
Such researchers have underscored serious shortcomings inherent in typical developmental models that incorporate autoregressive effects (i.e., panel models; Rogosa & Willett, 1985). The shortcomings they identify are fourfold:
1. In models depicting growth or developmental change, the sample means often carry useful statistical information. However, in a typical autoregressive covariance structural model, the parameters of interest are the variances and covariances of the independent variables. The means of the measured variables are implicitly assumed to be zero. Therefore, this common method of model estimation is inadequate because it fails to consider the influence of both inter- and intraindividual differences in development.
2. The panel model fails to provide adequate generalization to more than two points in time. With more than two time points, it becomes less clear which autoregressive effect should be controlled for when evaluating the significance of other predictors in the model. The best that can be done, even in multiwave panel models, is to focus on change scores between any two points in time.
3. By controlling for initial levels (i.e., including the autoregressive effect), the panel model tends to eliminate all predictors except those that predict changes in the rank order of the observations over time. This is a disadvantage when studying monotonically stable phenomena (Meredith & Tisak, 1990), in which the rank order of the observations stays the same although significant change at the individual and group levels can also be occurring.
4. The autoregressive effect is questionable as a true causal effect. Researchers such as Rogosa et al. (1982) and Rogosa and Willett (1985) provide a comprehensive discussion of the problems with panel models incorporating autoregressive effects.
TOWARD AN INTEGRATED DEVELOPMENTAL MODEL
An appropriate developmental model is one that not only describes a single individual’s developmental trajectory, but also captures individual differences in these trajectories over time. If, for example, these trajectories produced a collection of straight lines for a sample of individuals, the developmental model should reflect individual differences in the slopes and intercepts of those lines. Another critical attribute of the developmental model is the ability to study predictors of individual differences to answer questions about which variables exert important effects on the rate of development. At the same time, the model should be able to capture the vital group statistics in a way that allows the researcher to study development at the group level. Latent variable growth curve methodology meets all of these criteria.
The recent resurgence of interest in time-ordered approaches that can incorporate information concerning the group or population, while conveying specific information about changes in the individual, has reintroduced the formative work of Rao (1958) and Tucker (1958). These researchers constructed a procedure that included unspecified longitudinal curves or functions. Rao and Tucker promoted the idea that, although a common developmental trajectory can be constructed to describe all individuals, individual differences are both meaningful and important. Researchers such as Meredith and Tisak (1990) and McArdle (1988) have extended Rao and Tucker’s basic model of growth curve analysis to permit the use of current standards in estimation and testing procedures found in structural equation modeling (SEM) programs such as LISREL (Jöreskog & Sörbom, 2004), EQS (Bentler & Wu, 2005), Amos (Arbuckle, 2003), and Mplus (L. K. Muthén & B. O. Muthén, 2004). This methodology, which has gained recent popularity as the “latent growth curve” model, provides a means of modeling development as a factor of repeated observations over time. Within this approach, age is viewed as a dimension along which behavior changes are superimposed, forming part of the definition of the dependent variable in developmental studies.
Because latent growth modeling (LGM) is carried out using SEM methodology, it shares many of the same strengths and weaknesses with regard to statistical methodology. Some of the strengths of the LGM approach include the capacity to test the adequacy of the hypothesized growth form, to incorporate time-varying covariates, and to develop from the data a common developmental trajectory, thus ruling out cohort effects.
The more commonly cited limitations of SEM programs for estimating LGM models include the assumption of multinormally distributed variables and the necessity of large samples, although several SEM programs are now capable of handling ordered categorical outcomes within the LGM framework, and recent Monte Carlo simulations have demonstrated that basic LGMs hold up well with relatively small total numbers in a sample (N) (e.g., L. K. Muthén & B. O. Muthén, 2002). Therefore, the requisite N largely depends on the specific empirical context (e.g., psychometric behavior of indicators, amount of missing data, size of effects) and design aspects, such as the number of assessment points.
In addition, a fundamental assumption of growth curve methodology is that change is systematically related to the passage of time, at least over the time interval of interest (Burchinal & Appelbaum, 1991). Ware (1985) referred to this kind of data as “balanced-on-time.” Evaluating the extent to which a particular growth model is capable of describing the observed pattern of change with respect to time is an important part of growth model testing. The application of LGM within the SEM framework is still largely dependent, at least ideally, on data that are collected when subjects are observed at about the same points in time and the spacing of assessments is roughly the same for all individuals. Longitudinal panel data is typical of this design. Other growth curve techniques are available for growth analyses (e.g., Bryk & Raudenbush, 1987; Hui & Berger, 1983; Kleinbaum, 1973) when the number of time points, or the spacing between time points, varies across individuals. LGM can be applied to circumstances in which individuals are not measured within the same time intervals (see L. K. Muthén & B. O. Muthén, 2004); however, specific constraints must be placed on the models for parameter identification.
SEM methodology can be applied if change in the variables of interest is unrelated to time. That is, any ordinal variable can be used as the index of the basis function. Time is only one useful possibility. However, if change is not systematically related to the passage of time, the models lose their growth curve interpretations and studying individual trajectories over time will not be very informative. In this case, a repeated measures regression approach, such as generalized estimating equations (GEE; Liang & Zeger, 1986), is more appropriate.
Modeling growth or development within the latent variable SEM framework is a potentially valuable methodology that many researchers believe is underused (e.g., Bryk & Raudenbush, 1987; Meredith & Tisak, 1990; Rogosa & Willett, 1985; Rogosa et al., 1982; Willett, Ayoub, & Robinson, 1991). It is likely that increased use of growth curve methodology, in any form, will bolster researchers’ success in identifying important predictors and correlates of change.
LGM concepts, issues, and applications are presented in the following chapters. Heuristically, growth curve methodology can be thought of as consisting of two stages. The first stage focuses on accurately describing and summarizing individual differences in growth trajectories, if they exist. Here, parameters of the growth curves, rather than the original variables, are of interest. In the second stage, the parameters for an individual’s growth curve, rather than the original measures, become the focus of the analysis.
Chapter 2 presents an introduction to growth analyses using a simple two-factor LGM for two points in time. The chapter includes informal definitions and interpretations as well as formal specifications for the various model parameters.
The ideas presented in chapter 2 are illustrated in chapter 3 within the more familiar analysis of variance (ANOVA) context. The first section of chapter 3 provides a simple comparison of a growth curve model analyzed by both repeated measures ANOVA and LGM methodologies. Having described individual differen...