eBook - ePub
Visualization in Landscape and Environmental Planning
Technology and Applications
- 320 pages
- English
- ePUB (mobile friendly)
- Available on iOS & Android
eBook - ePub
Visualization in Landscape and Environmental Planning
Technology and Applications
About this book
This major reference presents the challenges, issues and directions of computer-based visualization of the natural and built environment and the role of such visualization in landscape and environmental planning. It offers a uniquely systematic approach to the potential of visualization and the writers are acknowledged experts in their field of specialization. Case studies are presented to illustrate many aspects of landscape management including forestry, agriculture, ecology, mining and urban development.
Tools to learn more effectively

Saving Books

Keyword Search

Annotating Text

Listen to it instead
Information
Part I
Understanding visualization
CHAPTER I
COMMUNICATION, PERCEPTION AND VISUALIZATION
Eckart Lange and Ian D.Bishop
Why visualize?
Humans perceive their environment through their senses. Commonly these are distinguished as an auditive system (the sense of hearing), a tactile system (the sense of touch), a kinaesthetic system (the ability to sense and coordinate movement), a vestibulary system (the sense of balance), an olfactory system (the sense of smell), a gustatory system (the sense of taste) and a visual system (the visual sense). Vision is easily the dominant component. This is underlined in everyday language by phrases such as seeing is believing and a picture is worth a thousand words, also a grand idea is a vision and we envision the future. Indeed, Bruce et al. (1996) estimated that 80 per cent of our impression of our surroundings comes from sight.
Because of our long history of drawing pictures of our environment and the important entities within it, we hardly need to answer the question ‘Why visualize?’ On the other hand, technology is giving us wholly new ways to visualize and to use visualization. This makes it worth reiterating some key points.
- We want visualization to give us the opportunity to see, experience and understand environmental changes before they occur.
- Through the ability to share this experience and potential for exploration, visualization will help communities (of whatever size) to build consensus and make decisions about their future.
- The relationship of people to their environment is a key contributor to environmental decisions and visualization can help us learn more about that relationship.
Being able to visually represent the existing real world as well as potential alterations is essential for landscape designers and planners to express and communicate their thoughts. In the past, maps, plans and sections have been predominately used. These representations are at a high level of abstraction. For the understanding of both the general public and the experts, it is important to communicate a proposal in perspective view, providing a more natural and direct approach to communication.
A brief history
For several thousands of years people have been using images to convey information. Traditional analog visualization techniques for the representation of concepts in planning and design are plans, sections, sketches, perspective drawings, photomontages, and physical models. Of these techniques, physical models, such as the ones found in Egypt and early Chinese tombs, and sketches are the oldest (Zube et al. 1987). Examples of drawings date back beyond 30 000 BC as illustrated by the charcoal drawings in the cave of Chauvet-Pont-d’Arc (Ministère de la Culture et de la Communication 2003).
Despite the fact that these visualizations were produced thousands of years ago they are sometimes so well preserved that we can even extract information about the state of the environment at the time. Plants and animals depicted in prehistoric rock art in the Sahara region provide impressions of a long gone, much more humid landscape quite different to our mental image of the Sahara today (Figure 1.1)
Many of these early cave paintings represent the important animals of the local environment at the time. For whatever reason, the ancient visualizers chose to concentrate on specific components of their environment (e.g. horses and bison) while only very occasionally providing representation of other animal groups such as birds and fish. This selectivity has been a feature of the visualization process ever since.
Mapping is known to have commenced at least 8000 years ago. One of the earliest known maps is from Turkey, dated at around 6200 BC (Delano-Smith 1987). Because of its similarity to the layout of the excavated houses, this wall painting is interpreted as a portrayal, in plan, of the old settlement of Catal Hüyük.
The first known examples of terrain representation date from more than 4000 years ago, scratched onto clay tablets (see Delano-Smith 1987). The mapping of Ga-Sur (now Yorghan Tepe), near Kirkuk in present day Iraq (dated 2300 BC), illustrates the earliest known examples of a topographic map with a correct orientation. A little later, scale drawing of the town of Nippur (ca. 1500 BC) shows that the Babylonian cartographers practised the essential principles of mapmaking as we know them today (Delano-Smith 1987). Between that time and the second half of the twentieth century these two-dimensional representational techniques were refined and our knowledge of the world expanded rapidly but the essential form of maps remained the same. However, cartographers were also seeking a more natural interpretation of spatial arrangements through a pseudo three-dimensional representation (Figure 1.2).
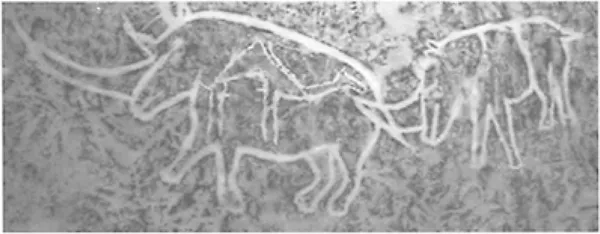
1.1 Rubbings of prehistoric carvings from the Sahara showing both rhinoceros and camel.
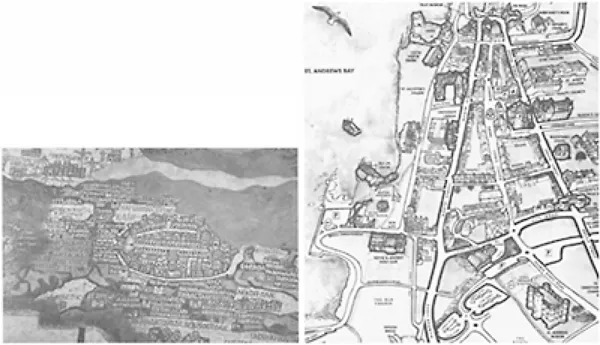
1.2 The use of a pseudo three-dimensional approach has been common in mapping for hundreds of years: (below) Palestine 565 AD; (right) StAndrews,Scotland 2004 AD
Developments in three-dimensional representation came during this period as much from the world of art as from science. The technology of perspective had a substantial impact in the early fifteenth century. Although invented around 465 BC in Greece (as proved by skenographic representations, in Geyer 1994), it was several hundred years before the perspective was reinvented in the Renaissance, and became a common tool for the presentation of final architectural designs. The oldest known perspective from this period is a mural dated after 1317 by Giotto in the Bardi Chapel of Santa Croce in Florence. The Italian artist and architect Filippo Brunelleschi (1377–1446) further developed the technique of perspective drawing. He established the use of a ‘vanishing point’, an imaginary single point on the page at which all the parallel lines meet. The use of the vanishing point was particularly important as three-dimensional representation of landscapes developed. In the sixteenth century, Albrecht Dürer wrote an introductory manual of geometric theory for students (Figure 1.3). This includes the first scientific treatment of perspective by a Northern European artist (Dürer 1525).
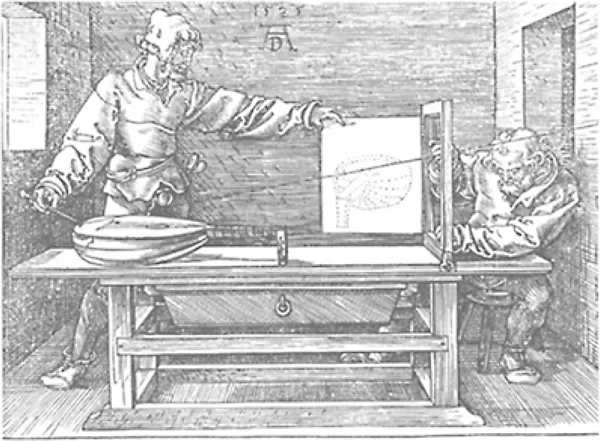
1.3 An analogue technique for deriving perspective (from Dürer 1525)
Within the discipline of landscape architecture Humphry Repton (1803) pioneered visualization applied to design issues on a site and on a landscape scale. In his famous Red Books, which he used to show his designs to his clients, he concentrated on the representation of proposed changes in the landscape in perspective view. The existing situation could be compared with the proposal by having the proposal drawn under a movable flap (Figure 1.4). Purposefully, he made little use of two-dimensional representations. A variation of this before-and-after technique was used by Frederick Law Olmsted for communicating his famous design for Central Park, New York (Beveridge and Schuyler 1983).
A specific branch of drawing and painting is the panorama. It was invented and patented in 1787 by Robert Barker (1739–1806) (Oettermann 1980; Comment 2000). In another crossover between art and science in the generation of landscape simulations, what we today consider an art form was then judged as a technical and scientific idea. The first panorama drawn by Barker illustrated the view from Carlton Hill overlooking Edinburgh. Independently, the artists, engineers and scientists Hans Conrad Escher von der Linth (1767–1823) and Johann Adam Breysig (1766–1831) also produced their first panoramas. Documentary panoramas in small formats were frequently produced to realistically portray a contemporary or historical urban or rural landscape. In the nineteenth century the monumental panorama became an early mass medium attracting numerous visitors: the equivalent to today’s Imax theatres.
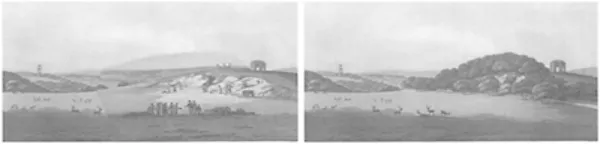
1.4 Repton’s approach to before and after landscape representation (images reproduced in the colour plate section)
To show the panoramas, specifically constructed buildings (rotundas) were set up in many major cities of central Europe and North America. Popular motifs were martial scenes and war victories but, equally, panoramas of well-known cities, spectacular landscapes and exotic travel destinations were on display.
With the rise of photography, which was easier to use and much faster to produce, the panorama lost popularity in the middle of the nineteenth century. Nowadays, most panoramas have been destroyed. The oldest remaining example, painted by Marquard Wocher between 1809 and 1814 on a canvas of 7.5 m x 39 m, is in Thun, Switzerland. The panorama of the battle of Murten (1880) was recently reconstructed (at great expense) for the Swiss Expo of 2002. In a giant rusty cube designed by Jean Nouvel amidst the Lake of Murten and only accessible by boat, in a panoramic multimedia installation, the real panoramic view across the lake and the historic Murten panorama could be compared ( Figure 1.5). This mixing of media suggests a renewed interest in panorama as a form of communication and entertainment. Photographic techniques and especially the emergence of digital photography have allowed fast and easy production of photographic panoramas. The benefit of the digital panorama is that it can be seen in a wide variety of sizes, from a scrolling window on a computer screen to projection-based panoramas just as large as their painted forebears.
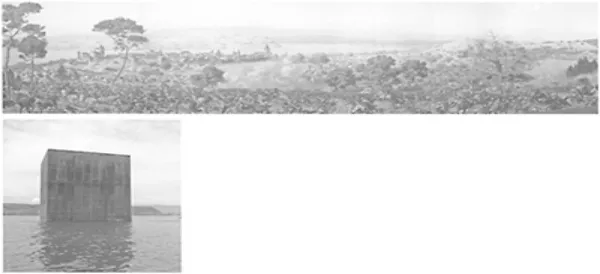
1.5 The battle of Murten (above) as a painted panorama and (left) its special exhibit space in the lake
The scientific approach to perspective made it easy, several centuries after Giotto and Dürer, for computers to create perspective drawings. Early three-dimensional representations in computer-aided design (CAD) were restricted to parallel projection (commonly isometric). However, some very early approaches to landscape representation were drawn in perspective. Myklestad and Wagar (1977) used minimalistic tree symbols in order to show proposed landscape changes caused by timber harvesting and regrowth through the silvicultural rotation (see also Figure 1.9). Also at the end of the 1970s, the Defense Mapping Agency in the USA began to develop visualizations to support advanced aerospace systems. Examples with shaded relief, draped imagery from remote sensing and shaded building volumes (Faintich 1980) marked the beginning of a dramatic period of development in the style of landscape representation. The emphasis during this period was on static display options. A notable exception was the work of Molnar (1986) who argued the case for real-time exploration of landscape designs. He was, however, limited to wire-frame representation.
Animation of simulated landscapes for planning purposes did not begin with computer graphics (Zube et al. 1987). Working in the analog rather than digital world, the pioneers of dynamic simulation came from the Berkeley Environmental Simulation Laboratory (Appleyard and Craik 1978). Among analog techniques, only the physical model permits free, i.e. dynamic, eye movement of the observer. Using a miniature camera hung from overhead gantries (Bosselmann 1983), models can be explored at eye level. The camera system was called an endoscope or modelscope and gave the user freedom of movement through their urban model (Figure 1.6). However, even a very precise physical model with detailed objects and exact contouring cannot capture the visual appearance of an environment completely. The presence of haze, for example, cannot be simulated in a physical model, as seen in Figure 1.7.

1.6 The three-dimensional model as a visualization environment: (right) a view of an urban streetscape (with manual edlting); (far right) the gantry system which carried the camera along defined paths
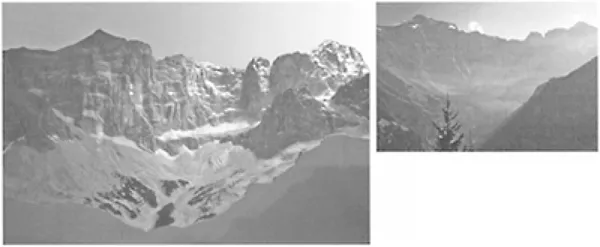
1.7 The physical model shows well the terrain surface but cannot portray the typical atmospheric conditions of the site: (above) real landscape, Großer Windgällen; (left) physical model by Eduard Imhof
For some time, the photomontage has been a common technique for creation of images of changing landscapes (e.g. Bureau of Land Management 1980). In the 1980s, computer graphics cards and software emerged which allowed photographs to be captured, stored and manipulated. Elements could be cut from one image and pasted into another. As a result, the analog photomontage was quickly superseded by the digital photomontage (Lange 1990; Orland 1988). Unlike the traditional analog photomontage, a digital photomontage can reach a relatively high level of geometric accuracy. This can be achieved by superimposing three-dimensional vector data over the two-dimensional image data (Figure 1.8).
Meanwhile, three-dimensional presentation of spatial data using computers was developing at the Laboratory for Computer Graphics and Spatial Analysis at the Harvard Graduate School of Design. Dougenik (1979) and Hanson and Lynch (1979) showed census and other demographic data as a pseudo terrain surface. Developments in this period also laid the foundation for further development of recently established GIS and image-based software products (Dangermond et al. 1981) establishing the need for three-dimensional visualization capabilities in standard commercial products (Faust et al. 1981).
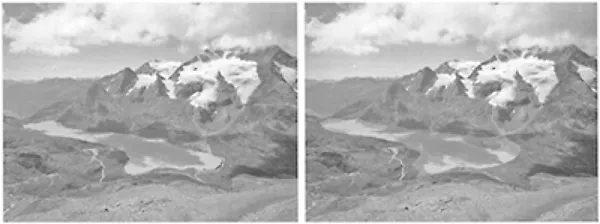
1.8 The expansion of an existing reservoir (left) is simulated by placing a CAD perspective over a photograph (right)
This was the basis for the later explosion of interest in scientific visualization that emerged in the 1980s with the realization that computer graphics—and three-dimensional representation in particular—could display complex data in ways previously impossible (McCormick et al. 1987). The new display options permitted scientists to find relationships or understand structures that had been obscure. Initially the development of new vi...
Table of contents
- COVER PAGE
- TITLE PAGE
- COPYRIGHT PAGE
- PREFACE
- FOREWORD
- CONTRIBUTORS
- ACKNOWLEDGEMENTS
- PART I: UNDERSTANDING VISUALIZATION
- PART 2: APPLICATIONS
- PART 3: PROSPECTS
- REFERENCES
Frequently asked questions
Yes, you can cancel anytime from the Subscription tab in your account settings on the Perlego website. Your subscription will stay active until the end of your current billing period. Learn how to cancel your subscription
No, books cannot be downloaded as external files, such as PDFs, for use outside of Perlego. However, you can download books within the Perlego app for offline reading on mobile or tablet. Learn how to download books offline
Perlego offers two plans: Essential and Complete
- Essential is ideal for learners and professionals who enjoy exploring a wide range of subjects. Access the Essential Library with 800,000+ trusted titles and best-sellers across business, personal growth, and the humanities. Includes unlimited reading time and Standard Read Aloud voice.
- Complete: Perfect for advanced learners and researchers needing full, unrestricted access. Unlock 1.4M+ books across hundreds of subjects, including academic and specialized titles. The Complete Plan also includes advanced features like Premium Read Aloud and Research Assistant.
We are an online textbook subscription service, where you can get access to an entire online library for less than the price of a single book per month. With over 1 million books across 990+ topics, we’ve got you covered! Learn about our mission
Look out for the read-aloud symbol on your next book to see if you can listen to it. The read-aloud tool reads text aloud for you, highlighting the text as it is being read. You can pause it, speed it up and slow it down. Learn more about Read Aloud
Yes! You can use the Perlego app on both iOS and Android devices to read anytime, anywhere — even offline. Perfect for commutes or when you’re on the go.
Please note we cannot support devices running on iOS 13 and Android 7 or earlier. Learn more about using the app
Please note we cannot support devices running on iOS 13 and Android 7 or earlier. Learn more about using the app
Yes, you can access Visualization in Landscape and Environmental Planning by Ian Bishop, Eckart Lange, Ian Bishop,Eckart Lange in PDF and/or ePUB format, as well as other popular books in Architecture & Urban Planning & Landscaping. We have over one million books available in our catalogue for you to explore.