Chapter 1
Data analysis and the research process
- Quantitative data analysis and the research process
- Causality and research design
- Survey design and causality
- Exercises
THIS BOOK LARGELY covers the field that is generally referred to as ‘statistics’, but as our Preface has sought to establish, we have departed in a number of respects from the way in which this subject is conventionally taught to under- and post-graduates. In particular, our preferences are for integrating data analysis with computing skills and for not burdening the student with formulae. These predilections constitute a departure from many, if not most, treatments of this subject. We prefer the term ‘quantitative data analysis’ because the emphasis is on the understanding and analysis of data rather than on the precise nature of the statistical techniques themselves.
Why should social science students have to study quantitative data analysis, especially at a time when qualitative research is coming increasingly to the fore (Bryman, 1988a)? After all, everyone has heard of the ways in which statistical materials can be distorted, as indicated by Disraeli’s often-quoted dictum: ‘There are lies, damn lies and statistics.’ Why should serious researchers and students be prepared to get involved in such a potentially unworthy activity? If we take the first issue – why should social science students study quantitative data analysis – it is necessary to remember that an extremely large proportion of the empirical research undertaken by social scientists is designed to generate or draws upon quantitative data. In order to be able to appreciate the kinds of analyses that are conducted in relation to such data and possibly to analyse their own data (especially since many students are required to carry out projects), an acquaintance with the appropriate methods of analysis is highly desirable for social science students. Further, although qualitative research has quite properly become a prominent strategy in sociology and some other areas of the social sciences, it is by no means as pervasive as quantitative research, and in any case many writers recognise that there is much to be gained from a fusion of the two research traditions (Bryman, 1988a).
On the question of the ability of statisticians to distort the analyses that they carry out, the prospects for which are substantially enhanced in many people’s eyes by books with such disconcerting titles as How to Lie with Statistics (Huff, 1973), it should be recognised that an understanding of the techniques to be covered in our book will greatly enhance the ability to see through the misrepresentations about which many people are concerned. Indeed, the inculcation of a sceptical appreciation of quantitative data analysis is beneficial in the light of the pervasive use of statistical data in everyday life. We are deluged with such data in the form of the results of opinion polls, market research findings, attitude surveys, health and crime statistics, and so on. An awareness of quantitative data analysis greatly enhances the ability to recognise faulty conclusions or potentially biased manipulations of the information. There is even a fair chance that a substantial proportion of the readers of this book will get jobs in which at some point they will have to think about the question of how to analyse and present statistical material. Moreover, quantitative data analysis does not comprise a mechanical application of predetermined techniques by statisticians and others; it is a subject with its own controversies and debates, just like the social sciences themselves. Some of these areas of controversy will be brought to the reader’s attention where appropriate.
Quantitative data analysis and the research process
In this section, the way in which quantitative data analysis fits into the research process – specifically the process of quantitative research – will be explored. As we will see, the area covered by this book does not solely address the question of how to deal with quantitative data, since it is also concerned with other aspects of the research process that impinge on data analysis.
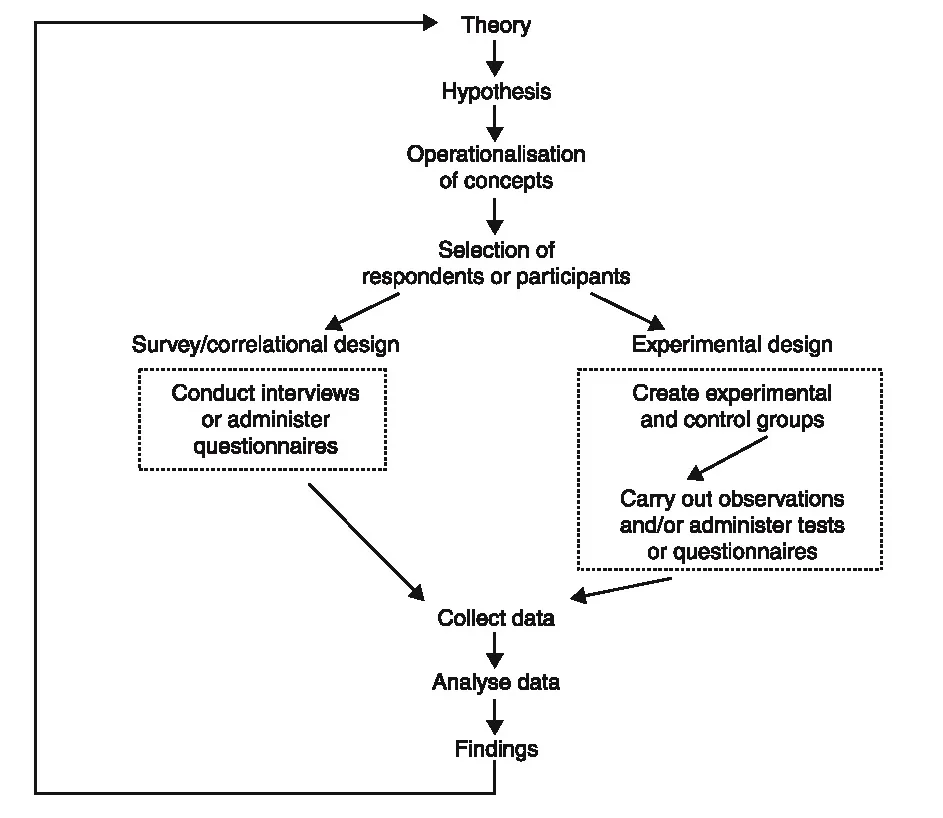
Figure 1.1 provides an illustration of the chief steps in the process of quantitative research. Although there are grounds for doubting whether research always conforms to a neat linear sequence (Bryman, 1988a, 1988b), the components depicted in Figure 1.1 provide a useful model. The following stages are delineated by the model.
Theory
The starting point for the process is a theoretical domain. Theories in the social sciences can vary between abstract general approaches (such as functionalism) and fairly low-level theories to explain specific phenomena (such as voting behaviour, delinquency, aggressiveness). By and large, the theories that are most likely to receive direct empirical attention are those which are at a fairly low level of generality. Merton (1967) referred to these as theories of the middle range, to denote theories that stood between general, abstract theories and empirical findings. Thus, Hirschi (1969), for example, formulated a ‘control theory’ of juvenile delinquency which proposes that delinquent acts are more likely to occur when the child’s bonds to society are breached. This theory in large part derived from other theories and also from research findings relating to juvenile delinquency.
FIGURE 1.1 The research process
Hypothesis
Once a theory has been formulated, it is likely that researchers will want to test it. Does the theory hold water when faced with empirical evidence? However, it is rarely possible to test a theory as such. Instead, we are more likely to find that a hypothesis, which relates to a limited facet of the theory, will be deduced from the theory and submitted to a searching enquiry. For example, Hirschi, drawing upon his control theory, stipulates that children who are tied to conventional society (in the sense of adhering to conventional values and participating or aspiring to participate in conventional values) will be less likely to commit delinquent acts than those not so tied. Hypotheses very often take the form of relationships between two or more entities – in this case commitment to conventional society and juvenile delinquency. These ‘entities’ are usually referred to as ‘concepts’, that is, categories in which are stored our ideas and observations about common elements in the world. The nature of concepts is discussed in greater detail in Chapter 4. Although hypotheses have the advantage that they force researchers to think systematically about what they want to study and to structure their research plans accordingly, they exhibit a potential disadvantage in that they may divert a researcher’s attention too far away from other interesting facets of the data he or she has amassed.
Operationalisation of concepts
In order to assess the validity of a hypothesis it is necessary to develop measures of the constituent concepts. This process is often referred to as operationalisation, following expositions of the measurement process in physics (Bridgman, 1927). In effect, what is happening here is the translation of the concepts into variables, that is, attributes on which relevant objects (individuals, firms, nations, or whatever) differ. Hirschi operationalised the idea of commitment to conventional society in a number of ways. One route was through a question on a questionnaire asking the children to whom it was to be administered whether they liked school. Delinquency was measured in one of two ways, of which one was to ask about the number of delinquent acts to which children admitted (i.e. self-reported delinquent acts). In much experimental research in psychology, the measurement of concepts is achieved through the observation of people, rather than through the administration of questionnaires. For example, if the researcher is interested in aggression, a laboratory situation may be set up in which variations in aggressive behaviour are observed. Another way in which concepts may be operationalised is through the analysis of existing statistics, of which Durkheim’s (1952 [1898]) classic analysis of suicide rates is an example. A number of issues to do with the process of devising measures of concepts and some of the properties that measures should possess are discussed in Chapter 4.
Selection of respondents or subjects
If a survey investigation is being undertaken, the researcher must find relevant people to whom the research instrument that has been devised (e.g. self-administered questionnaire, interview schedule) should be administered. Hirschi, for example, randomly selected over 5,500 school children from an area in California. The fact of random selection is important here because it reflects a commitment to the production of findings that can be generalised beyond the confines of those who participate in a study. It is rarely possible to contact all units in a population, so that a sample invariably has to be selected. In order to be able to generalise to a wider population, a representative sample, such as one that can be achieved through random sampling, will be required. Moreover, many of the statistical techniques to be covered in this book are inferential statistics, which allow the researcher to demonstrate the probability that the results deriving from a sample are likely to be found in the population from which the sample was taken, but only if a random sample has been selected. These issues are examined in Chapter 6.
Setting up a research design
There are two basic types of research design that are employed by psychologists and sociologists. The former tend to use experimental designs in which the researcher actively manipulates aspects of a setting, either in the laboratory or in a field situation, and observes the effects of that manipulation on experimental subjects. There must also be a ‘control group’ which acts as a point of comparison with the group of subjects who receive the experimental manipulation. With a survey/correlational design, the researcher does not manipulate any of the variables of interest and data relating to all variables are collected simultaneously. The term correlation also refers to a technique for analysing relationships between variables (see Chapter 8), but is used in the present context to denote a type of research design. The researcher does not always have a choice regarding which of the two designs can be adopted. For example, Hirschi could not make some children committed to school and others less committed and observe the effects on their propensity to commit delinquent acts. Some variables, like most of those studied by sociologists, are not capable of manipulation. However, there are areas of research in which topics and hypotheses are addressed with both types of research design (e.g. the study of the effects of participation at work on job satisfaction and performance – see Bryman, 1986; Locke and Schweiger, 1979). It should be noted that in most cases, therefore, the nature of the research design – whether experimental or survey/correlational – is known at the outset of the sequence signified by Figure 1.1, so that research design characteristics permeate and inform a number of stages of the research process. The nature of the research design has implications for the kinds of statistical manipulation that can be performed on the resulting data. The differences between the two designs are given greater attention in the next section.
Collect data
The researcher collects data at this stage, by interview, questionnaire, observation, or whatever. The technicalities of the issues pertinent to this stage are not usually associated with a book such as this. Readers should consult a textbook concerned with social and psychological research methods if they are unfamiliar with the relevant issues.
Analyse data
This stage connects very directly with the material covered in this book. At a minimum, the researcher is likely to want to describe his or her subjects in terms of the variables deriving from the study. For example, the researcher might be interested in the proportion of children who claim to have committed no, just one, or two or more delinquent acts. The various ways of analysing and presenting the information relating to a single variable (sometimes called univariate analysis) are examined in Chapter 5. However, the analysis of a single variable is unlikely to suffice and the researcher will probably be interested in the connection between that variable and each of a number of other variables, that is, bivariate analysis. The examination of connections among variables can take either of two forms. A researcher who has conducted an experiment may be interested in the extent to which experimental and control groups differ in some respect. For example, the researcher might be interested in examining whether watching violent films increases aggressiveness. The experimental group (which watches the violent films) and the control group (which does not) can then be compared to see how far they differ. The techniques for examining differences are explored in Chapter 7. The researcher may be interested in relationships between variables – are two variables connected with each other so that they tend to vary together? For example, Hirschi (1969: 121) presents a table which shows how liking school and self-reported delinquent acts are interconnected. He found that whereas only 9 per cent...