This book provides a state-of-the-art review of high-level vision and the brain. Topics covered include object representation and recognition, category-specific visual knowledge, perceptual processes in reading, top-down processes in vision -- including attention and mental imagery -- and the relations between vision and conscious awareness. Each chapter includes a tutorial overview emphasizing the current state of knowledge and outstanding theoretical issues in the authors' area of research, along with a more in-depth report of an illustrative research project in the same area.
The editors and contributors to this volume are among the most respected figures in the field of neuropsychology and perception, making the work presented here a standard-setting text and reference in that area.
eBook - ePub
The Neuropsychology of High-level Vision
Collected Tutorial Essays
- 400 pages
- English
- ePUB (mobile friendly)
- Available on iOS & Android
eBook - ePub
About this book
Trusted by 375,005 students
Access to over 1.5 million titles for a fair monthly price.
Study more efficiently using our study tools.
Information
I OBJECT REPRESENTATION AND RECOGNITION
1 Cortical Visual Areas and the Neurobiology of Higher Visual Processes
Alan Cowey
University of Oxford
“But the Emperor has nothing on at all.” In the crowd assembled to admire the Emperor’s splendid but invisible new clothes, the little child who uttered Hans Christian Andersen’s immortal words could do so precisely because he was a child, an innocent unrestrained by an adult’s reluctance to offend. For a few pages let us look childlike at some common beliefs about the neural basis of higher level vision and ask whether they are all built on granite or some are on shifting sands. The issue is important because to use an equally memorable tautology, “If we are not right, we are wrong.” I think we shall find that our ideas are not about to collapse but that some rebuilding and shoring-up are needed.
WHAT IS HIGHER-LEVEL VISION?
A higher level implies a lower level. What is the measure of level, the cognitive altimeter? Those who teach vision to students soon learn that higher level refers to the bits of visual perception that are complicated, in some sense more interesting, and poorly understood. Faces, objects, words, and consciousness are high level; edges, acuity, flow fields, detection thresholds, and visual reflexes are low level. Is it ever possible truly to understand higher levels before understanding the lower levels on which they depend? Those who take the existence of different levels of explanation for granted may find this a curious question but its self-evidence is not ubiquitous. Thirty years ago, in an invited lecture in Cambridge, England, David Hubel described his experiments with Torsten Wiesel on the receptive field properties of visual cortical neurons. Two Cambridge physiologists were overheard to comment on the futility of studying the visual cortex before we had understood the retina. We still do not fully understand the retina, nor how simple and complex cortical cells acquire their properties, but the leap from lower to higher was surely worthwhile. As T. H. Huxley said, “It’s only by going beyond the truth that one gets anywhere near the truth.” Let there be no apology for studying higher level vision before the eye surrenders its secrets.
CORTICAL VISUAL AREAS IN PRIMATES
The representation of the central few degrees of the retina on to the lateral surface of the striate cortex, Area 17, of monkeys was first demonstrated by Talbot and Marshall in 1941. It took another 20 years before Daniel and Whitteridge (1961) plotted the representation of the entire retina on to striate cortex. Striate cortex was not referred to then as primary visual cortex or by its handy modern label V1 because no other visual areas were then charted in monkeys. It was another 3 years before V2 and its topography were described (Cowey, 1964), and the end of that decade before V3, V4, and what is now known as MT or V5 (depending on which side of the Atlantic one prefers) were first described. By the end of the 1970s there were about a dozen well-established visual areas in the macaque monkey’s brain and at that delicious but brief period, which lasted perhaps 5 years, it seemed possible to relate each secondary or tertiary area to predominantly one aspect of visual information processing, and to selective disturbances of vision that sometimes occur following brain damage in neurological patients (Cowey, 1979, 1981, 1985).
As occasionally happens, the discovery of yet more visual areas has, as Chesterton’s Father Brown said of clues to crime, thrown darkness rather than light on the problem. Figure 1.1 shows a lateral view of the right cerebral hemisphere of a macaque monkey with several of the sulci opened out to reveal their depths. The instant impression is that it resembles a relief map of complicated and mountainous terrain. Visual areas, in most of which the retina is topographically represented to greater or lesser extent, abound and the pattern continues on the medial and ventral surfaces. Figure 1.2 shows the increasingly popular box and lines version of the same thing (Goldberg & Colby, 1989), which yearly grows more like the subway map of a major city without offering the same help in finding our way about. Indeed, it is already out of date because about 30 visual areas have now been identified in both Old-and New-World monkeys (Felleman & van Essen, 1991). Who would be bold enough to deny that our brains are not even more complex?
What can be made of this multiplicity of visual areas in relation to higher order visual processing? There is evidence from anatomical studies, from neurophysiological properties of neurons in these areas, from the effects of focal ablation or damage in monkeys and neurological patients, and more recently from neuroimaging.
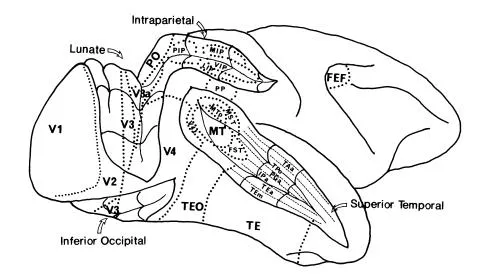
FIG 1.1 Surrealistic view of the lateral surface of the right cerebral hemisphere of a macaque monkey. The lunate, intraparietal, inferior occipital and superior temporal sulci have been opened to reveal their interior. Various visual areas are outlined. The difference in size of lettering has no significance and was done to minimize clutter. Further areas are present medially and ventrally. It is important to remember that the size and position of areas are approximate, and almost certainly vary among different brains.
Figures 1.1 and 1.2, which portray only cortical visual areas, conceal an uncomfortable fact: There are many “parallel” pathways from the eye into the brain. Relative to the geniculo-striate pathway we know little about their properties in primates and the contribution they may make to vision. We do not even know which of the well-known classes of retinal ganglion cells (Pa, Pß, and Py) provide the innervation for most of them. Although their importance to what are sometimes referred to as reflexive and purely subcortical visual functions such as circadian and other rhythms, the pupillary reflex, and postural adjustments to optic flow fields (see Simpson, 1984, for review) is undoubted, anatomical studies show that they could influence cortical visual areas. For instance, the retino-recipient region of the inferior pulvinar projects to extrastriate visual areas. The ventral lateral geniculate nucleus has projections to dLGN, as does the superior colliculus. Some of these pathways could well be involved in the phenomenon of blindsight (see later discussion).
Figure 1.3 is also a reminder that the overwhelming majority of optic axons terminate in the dLGN and that there are two metaphorically parallel pathways, whose contrasting contribution to vision has been intensively studied in the last decade. The retinal Pa cells innervate the two magnocellular layers of the dLGN,
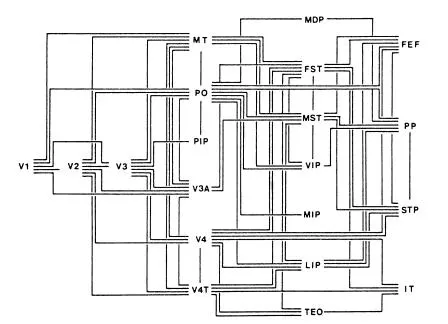
FIG 1.2 Schematic view of visual areas shown in Fig. 1.1, and arranged in hierarchical order from left to right. Each of the lines represents both a forward and a back projection. From Goldberg and Colby, 1989. Copyright 1989. Reprinted by permission
whose projection neurons provide the M pathway to predominantly layer 4C of Area V 1. The Pß cells innervate the parvocellular dLGN, whose projection neurons form the P pathway innervating predominantly layer 4CB of V1.1 From here the segregation is continued (although imperfectly) with the M pathway continuing to layer 4B, and from there both directly and sequentially to the thick cytochrome oxidase stripes of V2, to V3, and to Area MT. The P pathway bifurcates to innervate the cytochrome oxidase (CO) blobs of V1, which provide the major input to the thin CO stripes of V2, and the interblobs of V1, which innervate the pale CO stripes of V2. In a manner not yet understood, both P compartments of V2 project to V4 and thence to Area TE.
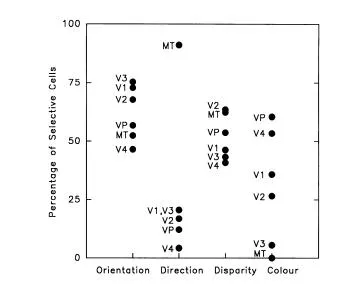
FIG 1.3 The percentage of cells in six different visual areas that are tuned to orientation, direction, disparity, and color. Each point is the mean of from 1 to 10 different investigations and the substantial variation in estimates among different studies is not shown. The major, and perhaps only, impressive difference is that neurons in Area MT are highly selective for direction of motion and unselective for colour whereas the opposite pattern occurs for V4. The points were calculated from the data presented by Felleman and Van Essen, 1987.
It might be thought that the clear anatomical segregation of the P and M pathways should be reflected in their physiological properties and role in behavior. For example, Pa cells and neurons in the M channel have broadband spectral responses, high contrast gain, are relatively transient, are more likely to be nonlinear, and respond well to high temporal modulation. They seem well equipped to detect achromatic contrast and moving or brief or flickering stimuli. The P channel seems better equipped to deal with color contrast and color change. Some of these predictions about P and M pathways, principally their role in color and depth, and discrimination of flicker and movement have been amply confirmed by ingenious experiments in which one pathway has been selectively damaged at the level of the dLGN (for reviews, see Merigan & Maunsell, 1990; Schiller, Logothetis, & Charles, 1990). However, as soon as these two major pathways are damaged at an early extrastriate cortical level—for example, Area V4 versus Area MT, the contrasting deficits are much less clear. For example, removing all or part of V4 has relatively slight effect on wavelength discrimination in the corresponding part of the visual field (Heywood & Cowey, 1987, 1992; Schiller & Logothetis, 1990). Nor are other important distinctions between the P and M channels uncontested, even at the level of the dLGN, notably those involving acuity and adaptation level. Although the P channel is often said to respond to higher spatial frequencies than does the M channel and the discrimination of fine detail is imparied by parvocellular lesions (Schiller et al., 1990), there is evidence from single-cell recordings that resolution in the two channels may not be significantly different (Crook, Lange-Malecki, Lee, & Valberg, 1988). With respect to adaptation level, it has been argued that at scotopic levels only the M channel is active (Purpura, Kaplan, & Shapley, 1988), yet even earlier it was shown that some parvocellular cells changed their characteristic photopic color-opponent organization to a rod-based scotopic sensitivity with dark adaptation (Wiesel & Hubel, 1966), implying that they are not night-blind. Lastly, even the anatomical and physiological apartheid of the two channels has been challenged (Martin, 1992), although this may not be as damaging as some believe because interactions between the two channels are almost a sine qua non of selectively attending to one at the expense of the other or conjoining their separate signals in the creation of percepts.
For once, the clearest evidence of a reasonably sharp distinction between P and M channels comes from psychophysical examination of patients with cerebral achromatopsia, where much if not all of the disorder can be interpreted in terms of selective destruction of a major extrastriate part of the P channel (Heywood, Cowey, & Newcombe, 1991). Cerebral achromatopsia is a rare disorder caused by cortical damage to the lingual and fusiform gyri on the ventro-medial surface of the occipito-temporal region (see Damasio, Yamada, Damasio, Corbett, & McKee, 1980; Zeki, 1990 for reviews). It is usually but not invariably conjoined with prosopagnosia. The patient describes the visual world as gray where it used to be colored and is unable to sort insoluminant colors (the FarnsworthMunsell 100-hue test) into their proper spectral order, arranging them instead at random. Yet the patient may be able to tell whether two insoluminant and contiguous hues are identical or different, even with small differences in hue (Heywood et al., 1991). How is this accomplished? Many neurons in the magnocellular dLGN and its Pa cell retinal input, and in its cortical representation, have no null point at which the chromatic border between isoluminant colors becomes undetectable (Derrington, Krauskopf, & Lennie, 1984; Hubel & Livingstone, 1990; Lee, Martin, & Valburg, 1989; Saito, Tanaka, Isono, Yasuda, & Mikami, 1989). These neurons are excellently equipped to signal borders, but cannot indicate whether they are chromatic or luminance borders. The achromatopsic patient may therefore use chromatic differences to detect borders and to perceive their orientation but has no information about the sign of the color. This interpretation of the deficit as a selective lesion in the extrastriate representation is consistent with a conspicuous reduction in contrast sensitivity at high spatial frequencies. However, the increment threshold spectral sensitivity curve has the normal form, indicative of color-opponent (P channel) activity, and cerebral achromatopsia may therefore be the result of destroying one arm of the cortical outputs of the P channel and implying that others, although still intact, make no contribution to the conscious appreciation of color. In recent experiments Heywood and I have found compelling evidence for this view. A high resolution color monitor was filled with an array of 38 × 38 small gray squares of different and consistently varying intensity. When a group of the squares, forming a cross, had either red or green light added while keeping mean luminance the same as the grays, the subject rapidly detected the position and shape of the hidden chromatic target. But no color was reported and red and green figures looked identical.
If part of the P channel can be selectively disrupted by a cortical lesion, what of the M channel? Although still incompletely described, there are patients whose visual impairment is the inverse of achromatopsia (Milner & Heywood, 1989; Rovamo, Hyvarinen, & Hari, 1982). For example, patient DF could arrange Munsell hues with only...
Table of contents
- Cover
- Half Title
- Carnegie Mellon Symposia on Cognition
- Full Title
- Copyright
- Contents
- Preface
- PART I. Object Representation and Recognition
- PART II. Visual Word Recognition
- PART III. Top-Down Processes in Vision: Attention and Imagery
- PART IV. High-level Vision With and Without Awareness
- Author Index
- Subject Index
Frequently asked questions
Yes, you can cancel anytime from the Subscription tab in your account settings on the Perlego website. Your subscription will stay active until the end of your current billing period. Learn how to cancel your subscription
No, books cannot be downloaded as external files, such as PDFs, for use outside of Perlego. However, you can download books within the Perlego app for offline reading on mobile or tablet. Learn how to download books offline
Perlego offers two plans: Essential and Complete
- Essential is ideal for learners and professionals who enjoy exploring a wide range of subjects. Access the Essential Library with 800,000+ trusted titles and best-sellers across business, personal growth, and the humanities. Includes unlimited reading time and Standard Read Aloud voice.
- Complete: Perfect for advanced learners and researchers needing full, unrestricted access. Unlock 1.5M+ books across hundreds of subjects, including academic and specialized titles. The Complete Plan also includes advanced features like Premium Read Aloud and Research Assistant.
We are an online textbook subscription service, where you can get access to an entire online library for less than the price of a single book per month. With over 1.5 million books across 990+ topics, we’ve got you covered! Learn about our mission
Look out for the read-aloud symbol on your next book to see if you can listen to it. The read-aloud tool reads text aloud for you, highlighting the text as it is being read. You can pause it, speed it up and slow it down. Learn more about Read Aloud
Yes! You can use the Perlego app on both iOS and Android devices to read anytime, anywhere — even offline. Perfect for commutes or when you’re on the go.
Please note we cannot support devices running on iOS 13 and Android 7 or earlier. Learn more about using the app
Please note we cannot support devices running on iOS 13 and Android 7 or earlier. Learn more about using the app
Yes, you can access The Neuropsychology of High-level Vision by Martha J. Farah,Graham Ratcliff in PDF and/or ePUB format, as well as other popular books in Psychology & Cognitive Neuroscience & Neuropsychology. We have over 1.5 million books available in our catalogue for you to explore.