- 248 pages
- English
- ePUB (mobile friendly)
- Available on iOS & Android
eBook - ePub
Introduction to Multivariate Analysis
About this book
This book provides an introduction to the analysis of multivariate data.It describes multivariate probability distributions, the preliminary analysisof a large -scale set of data, princ iple component and factor analysis,traditional normal theory material, as well as multidimensional scaling andcluster analysis.Introduction to Multivariate Analysis provides a reasonable blend oftheory and practice. Enough theory is given to introduce the concepts andto make the topics mathematically interesting. In addition the authors discussthe use (and misuse) of the techniques in pra ctice and present appropriatereal-life examples from a variety of areas includ ing agricultural research,soc iology and crim inology. The book should be suitable both for researchworkers and as a text for students taking a course on multivariate analysis.
Tools to learn more effectively

Saving Books

Keyword Search

Annotating Text

Listen to it instead
Information
PART ONE
Introduction
The first three chapters contain a variety of important introductory material.
Chapter 1 begins with some typical multivariate problems, and discusses ways of tackling them. The chapter also includes a section revising the more important results in matrix algebra.
Chapter 2 introduces the reader to multivariate probability distributions.
Chapter 3 shows how to carry out a preliminary analysis of a set of data. In particular, the chapter discusses how to feed the data into a computer without making too many errors, and also discusses the calculation of summary statistics such as means, standard deviations and correlations.
CHAPTER ONE
Introduction
Multivariate data consist of observations on several different variables for a number of individuals or objects. Data of this type arise in all branches of science, ranging from psychology to biology, and methods of analysing multivariate data constitute an increasingly important area of statistics. Indeed, the vast majority of data is multivariate, although introductory statistics courses naturally concentrate on the simpler problems raised by observations on a single variable.
1.1 Examples
We begin with some examples of multivariate data.
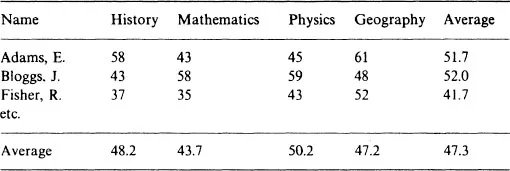
(a) Exam results. When students take several exams, we obtain for each student a set of exam marks as illustrated in Table 1.1. Here the ‘variables’ are the different subjects and the ‘individuals’ are the students.
The analysis of data of this type is usually fairly simple. Averages are calculated for each variable and for each individual. The examiners look at the column averages in order to see if the results in different subjects are roughly comparable, and then examine the row averages in order to rank the individuals in order of merit. This ranking is usually achieved by simply ordering the average marks of the students, though some more complicated averaging procedure is sometimes used. If the results for one exam appear to be out of line with the remainder, then these marks may be adjusted by the examiners. For example, in Table 1.1 the mathematics average is somewhat low and it might be deemed fair to scale the mathematics marks up in some way.
Table 1.1 Some typical exam results
Although the above analysis is fairly trivial, it does illustrate the general point that multivariate analyses are often concerned with finding relationships, not only between variables, but also between individuals.
A more sophisticated analysis might try to establish how particular students did particularly badly or particularly well, and also see if results in different subjects are correlated. For example, do students who perform above average in science subjects tend to perform below average in arts subjects (i.e., is there negative correlation)?
(b) A nutritional study. A survey was recently carried out on children in Nepal to examine the use of three measured variables in assessing nutritional status. The variables were height, weight and middle-upper-arm circumference (MUAC for short). The data also recorded the sex of each child (coded as 1 for males and 2 for females), the age of each child, and the social caste of each child (coded from...
Table of contents
- Cover
- Half Title
- Title Page
- Copyright Page
- Table of Contents
- Preface
- PART ONE: INTRODUCTION
- PART TWO: FINDING NEW UNDERLYING VARIABLES
- PART THREE: PROCEDURES BASED ON THE MULTIVARIATE NORMAL DISTRIBUTION
- PART FOUR: MULTIDIMENSIONAL SCALING AND CLUSTER ANALYSIS
- References
- Answers to exercises
- Name Index
- Subject Index
Frequently asked questions
Yes, you can cancel anytime from the Subscription tab in your account settings on the Perlego website. Your subscription will stay active until the end of your current billing period. Learn how to cancel your subscription
No, books cannot be downloaded as external files, such as PDFs, for use outside of Perlego. However, you can download books within the Perlego app for offline reading on mobile or tablet. Learn how to download books offline
Perlego offers two plans: Essential and Complete
- Essential is ideal for learners and professionals who enjoy exploring a wide range of subjects. Access the Essential Library with 800,000+ trusted titles and best-sellers across business, personal growth, and the humanities. Includes unlimited reading time and Standard Read Aloud voice.
- Complete: Perfect for advanced learners and researchers needing full, unrestricted access. Unlock 1.4M+ books across hundreds of subjects, including academic and specialized titles. The Complete Plan also includes advanced features like Premium Read Aloud and Research Assistant.
We are an online textbook subscription service, where you can get access to an entire online library for less than the price of a single book per month. With over 1 million books across 990+ topics, we’ve got you covered! Learn about our mission
Look out for the read-aloud symbol on your next book to see if you can listen to it. The read-aloud tool reads text aloud for you, highlighting the text as it is being read. You can pause it, speed it up and slow it down. Learn more about Read Aloud
Yes! You can use the Perlego app on both iOS and Android devices to read anytime, anywhere — even offline. Perfect for commutes or when you’re on the go.
Please note we cannot support devices running on iOS 13 and Android 7 or earlier. Learn more about using the app
Please note we cannot support devices running on iOS 13 and Android 7 or earlier. Learn more about using the app
Yes, you can access Introduction to Multivariate Analysis by Chris Chatfield in PDF and/or ePUB format, as well as other popular books in Mathematics & Probability & Statistics. We have over one million books available in our catalogue for you to explore.