Based on a tremendous increase in the development of psychometric theories in the past decade -- ranging from techniques for criterion-referenced testing to behavioral assessment, generalizability, and item response theory -- this book offers a summary of core issues. In so doing, it provides a comprehensive survey of reliability, validity, and item analysis from the perspectives of classical true-score model, generalizability theory, item response theory, criterion-referenced testing, and behavioral assessment. Related theoretical issues such as item bias, equating, and cut-score determination are also discussed. This is an excellent text for courses in statistics, research methods, behavioral medicine and cognitive science as well as educational, school, experimental, counseling/social, clinical, developmental, and personality psychology.
Trusted by 375,005 students
Access to over 1.5 million titles for a fair monthly price.
The classical theory (Gulliksen, 1950) is the earliest theory of measurement. Despite the development of the more comprehensive and sophisticated generalizability and item response theories in the past two to three decades, the classical theory of measurement maintains a strong influence among testing and measurement practitioners today. With the exception of some large-scale testing projects, many tests in existence today continue to provide evidence of data quality based on the classical approach.
The classical theory is also referred to as the classical reliability theory because its major task is to estimate the reliability of the observed scores of a test. That is, it attempts to estimate the strength of the relationship between the observed score and the true score. It is also sometimes referred to as the true score theory because its theoretical derivations are based on a mathematical model known as the true score model.
THE TRUE SCORE MODEL
When a test is administered to an individual, the observed score for the individual represents the ability of that individual on that particular sample of items administered at that particular occasion under a particular set of conditions. Many factors may affect the performance of the subject. The subject may perform differently had a different set of items on the same content area been used, had the test been given at a different time or under a different set of personal and environmental conditions.
If we were able to administer the test to the same subject under all possible conditions at different times using different possible items, we would have many different observed scores for that subject. The mean of all these observed scores would be the most unbiased estimate of the subject's ability. This mean is defined as the true score.
The observed score from any single administration of a test with a particular sample of items is most likely different from this true score. This difference is called random error score or simply error. Mathematically, this relationship can be expressed as:
(3.1)
where x is the observed score, t is the true score, and e is the error score. An interesting and somewhat tautological derivation of the true score model in Equation 3.1 is that, in the long run, the expected error is zero. Specifically, if we use the symbol E to represent “the average of” or “the expected value of,” then, in repeated administrations of the test:
(3.2)
Because E(x) is by definition true score t and E(t) is t, the expected e is zero. Therefore, although the observed score from a single administration of a test contains error, the average over many administrations of the test contains little error.
RELIABILITY ESTIMATION
Reliability is the strength of the relationship between the observed score and the true score. This can be expressed as the Pearson's correlation between the observed score x and the true score t; that is ρxt. This correlation is referred to as the reliability index (Crocker & Algina, 1986). The stronger the relationship, the better x reflects t. If this relationship is very strong as indicated by a high Pearson's r, one can view x as a linear transformation of t. That is, x is essentially t expressed on a different scale. Unfortunately, we cannot estimate ρxt directly from observed data because t values are unknown. However, it is possible to estimate the squared value of ρxt.
ASSUMPTION OF INDEPENDENCE
If we were to use the italicized t to represent
, x to represent
, and e to represent
, then, Et2 is the variance of t or true score variance or simply true variance, Ex2 is the variance of x or observed score variance or simply observed variance, Ee2 is the variance of e or error score variance or simply error variance, Ext is the covariance between x and t, and Ete is the covariance between t and e. Because the Pearson's r between X and Y is:
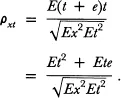
ρxt can be expressed as:
(3.3)
Given the true score model x = t + e, Equation 3.3 can be rewritten as:
(3.4)
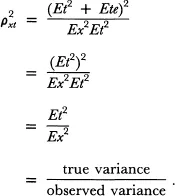
An assumption can be made that true score is unrelated to error score; that is, the amount of error made at any particular single administration of a test to a subject is independent of the true score for that subject. This is referred to as the assumption of independence. This assumption suggests that Ete = 0 or the covariance between t and e is zero. Given this assumption, the square of the reliability index ρxt as expressed in Equation 3.4 becomes:
(3.5)
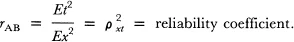
In other words, the square of the reliability index becomes the proportion of observed variance which is true variance. This squared reliability index is referred to as the reliability coefficient. Although it is not possible to estimate ρxt directly from observed data, it is possible to estimate ρ2xt when a particular set of assumptions known as parallel tests assumptions are met.
PARALLEL TESTS ASSUMPTIONS
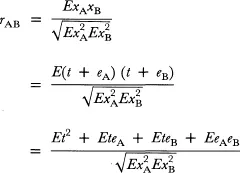
If two tests, A and B, designed to measure the same ability, are both given to the same group of subjects, the true score t for each subject remains the same on both tests. The Pearson's r between the two sets of observed scores becomes:
(3.6)
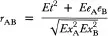
Given the assumption of independence, the second and third terms of the numerator in Equation 3.6 become zero and drop out of the equation. Hence:
(3.7)
This correlation can be used to estimate reliability coefficient
if we assume that the two tests, A and B, meet the parallel tests assumptions. The parallel tests assumptions refer to a set of assumed mathematical relationships between tests A and B. A complete set of these assumptions can be found in Nunnally (1978) and detailed derivations and proofs of these assumptions can be found in Lord and Novick (1968).
Of particular relevance to our discussion here are two specific assumptions: (a) Scores on Tests A and B have the same variance or
, and (b) the errors in Tests A and B are mutually independent or EeAeB = 0. Given these two assumptions, the second term in the numerator of Equation 3.7 becomes zero and drops out of the equation. Further, the denominator can be written as a general observed variance Ex2. Equation 3.7 becomes:
(3.8)
In other words, if we can identify two tests that can be assumed to meet the parallel tests assumptions, the Pearson's r between the observed scores on the two tests becomes the squared correlation between the observed and the true score.
It is important to point out that when a Pearson's r between two parallel tests is used to estimate the reliability coefficient of either of the two essentially interchangea...
Table of contents
Cover Page
Half Title Page
Title Page
Copyright Page
Contents
Introduction
2 Random Sampling Theory
3 Item Response Theory
4 Validity
5 Applied Issues
References
Author Index
Subject Index
Frequently asked questions
Yes, you can cancel anytime from the Subscription tab in your account settings on the Perlego website. Your subscription will stay active until the end of your current billing period. Learn how to cancel your subscription
No, books cannot be downloaded as external files, such as PDFs, for use outside of Perlego. However, you can download books within the Perlego app for offline reading on mobile or tablet. Learn how to download books offline
Perlego offers two plans: Essential and Complete
Essential is ideal for learners and professionals who enjoy exploring a wide range of subjects. Access the Essential Library with 800,000+ trusted titles and best-sellers across business, personal growth, and the humanities. Includes unlimited reading time and Standard Read Aloud voice.
Complete: Perfect for advanced learners and researchers needing full, unrestricted access. Unlock 1.5M+ books across hundreds of subjects, including academic and specialized titles. The Complete Plan also includes advanced features like Premium Read Aloud and Research Assistant.
Both plans are available with monthly, semester, or annual billing cycles.
We are an online textbook subscription service, where you can get access to an entire online library for less than the price of a single book per month. With over 1.5 million books across 990+ topics, we’ve got you covered! Learn about our mission
Look out for the read-aloud symbol on your next book to see if you can listen to it. The read-aloud tool reads text aloud for you, highlighting the text as it is being read. You can pause it, speed it up and slow it down. Learn more about Read Aloud
Yes! You can use the Perlego app on both iOS and Android devices to read anytime, anywhere — even offline. Perfect for commutes or when you’re on the go. Please note we cannot support devices running on iOS 13 and Android 7 or earlier. Learn more about using the app
Yes, you can access Principles of Test Theories by Hoi K. Suen in PDF and/or ePUB format, as well as other popular books in Education & Education General. We have over 1.5 million books available in our catalogue for you to explore.