eBook - ePub
Managing Urban Futures
Sustainability and Urban Growth in Developing Countries
- 293 pages
- English
- ePUB (mobile friendly)
- Available on iOS & Android
eBook - ePub
Managing Urban Futures
Sustainability and Urban Growth in Developing Countries
About this book
Urbanization is one of the most powerful forces influencing global sustainability. It is dominated by three factors: population growth, rural-urban migration and subsequent urban expansion. Perhaps nowhere are these factors more dominant than in developing countries. This volume brings together leading experts including Alan Gilbert, John Friedmann, Saskia Sassen and Janice Perlman to explore the conflicting challenges of rapid urbanization in developing countries. While all have to contend with key issues such as social segregation, poverty, and loss of governability, the ongoing forces of urban growth vary from country to country. By comparing the challenges of urbanization in Africa, Latin America, Asia and the Pacific, this book puts forward a new way of thinking about mega- and million-cities in developing countries - one that promotes their vital function in society as engines of ideas, technologies, societal change, democratic transformation and loci of political will to build a new regime of global sustainability.
Trusted by 375,005 students
Access to over 1.5 million titles for a fair monthly price.
Study more efficiently using our study tools.
Information
Topic
ArchitectureSubtopic
Urban Planning & LandscapingPart I
The Challenges of Urban Development Processes
Chapter 1
Asian Urbanization and Local and Global Environmental Challenges
Hans J.A. van Ginkel and Peter J. Marcotullio
Asia has experienced rapid development and urbanization in the last half of the 20th century. The transformations have reached unprecedented scales. Many indicators have been used to demonstrate the improvement in overall human well-being, notably those advancements related to income, longevity and some health measures, but this only tells part of the story. The great transformations now in process have been accompanied by both local and global challenges to environmental sustainable development. Moreover, there are indications that the challenges will increase in intensity into the future. It is crucially important to identify the dynamics underlying these developments and point to policies that could begin to address their impacts.
This chapter describes the economic and urbanization transformations experienced by Asian cities. It then explores some of the local and global environmental challenges that have accompanied these changes. Specifically, for local issues, we identify the ‘infrastructure time-bomb’ – defined as the overburdening of old, out-of-date, and overused basic infrastructure (e.g., water supply and sanitation) – within some of these cities. Future urbanization will only increase the burden on these structures and if not addressed, the situation may grow into a crisis.
In order to address these issues, integrated approaches to planning and urban management are needed. We look to specific examples within the Netherlands to see how a small country, characterized by high population density, solved its resource and spatial planning challenges. The results suggest some lessons for Asian cities. Finally, these observations and analyses have encouraged the United Nations University (UNU) to rethink the direction of its Urban Programme. The last section presents thoughts on how this new program will provide research and capacity building to help address these issues.
Asian Urbanization and Local Environmental Challenges
Asia has been undergoing a rapid and intensive urban transition. As Table 1.1 demonstrates, since 1950 more than 1 billion people have been moved into the region’s cities, bringing the percentage of urban population up from 17 to more than 36 per cent. This immense process of urbanization is far from over. With only 38 per cent of the region’s population currently living in dense human settlements,
Table 1.1 Comparative aspects of Asian urbanization (population in thousands)
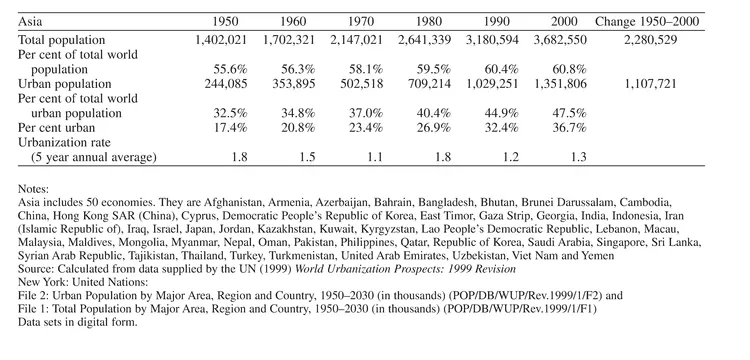
the next 30 years will bring even greater changes (see Table 1.2). Approximately 1.25 billion of the total 2 billion inhabitants added to global urban population will end up in cities in Asia by 2030. This will change Asia’s urbanization rate from 36 to 53 per cent and increase the region’s share of the world’s total urban population. It is estimated that by 2030 more than 53 per cent of the total global urban population will be found in Asia.
Asian urbanization has occurred at some of the fastest rates in history. The average increases for the region varied between 1.2 and 1.8 per cent, but this masks the high speed of change in some countries. For example, South Korea’s annual urbanization rates were over 3 per cent from 1960 to 1980, and for the years 1965 to 1970 reached 4.6 per cent. Thus, not only does the absolute number of individuals
Table 1.2 Comparison of size and share of urban populations by region, 2000 and 2030 (population in thousands)
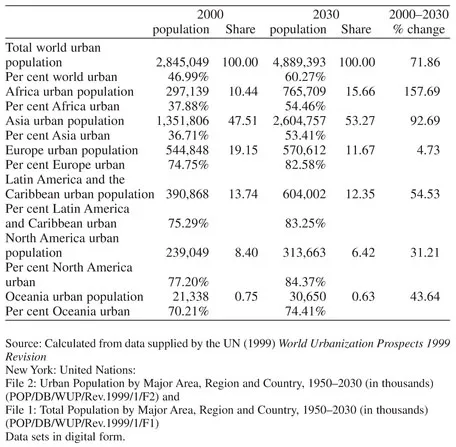
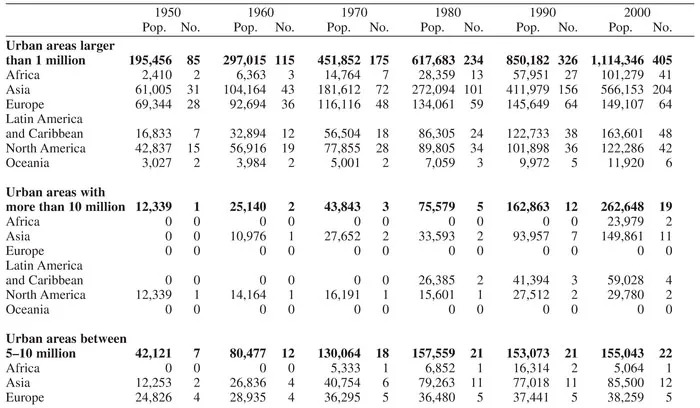
Table 1.3 Regional comparison of growth in large urban areas, 1950-2000 (population in thousands)
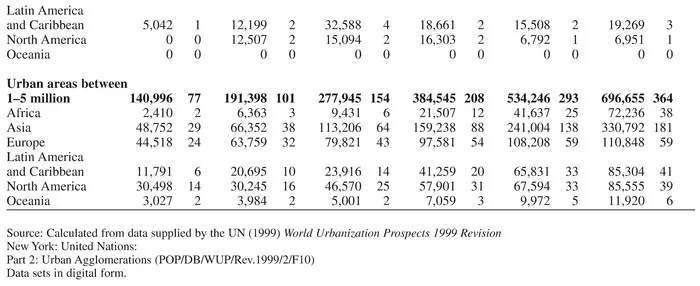
moving to cities in the region dwarf anything previously experienced but the rates of increase are also unprecedented.
Another feature of Asian urbanization is the rise of large urban agglomerations. Table 1.3 demonstrates the rise of these urban agglomerations since the middle of the 20th century. The total number of large cities (i.e., those greater than 1 million) climbed from 85 in 1950 to 405 in 2000. The largest per cent increase among the different sizes of cities was the ‘mega-cities’ category (i.e., those equal to or greater than 10 million inhabitants). According to the UN (1999), there was one mega-city in 1950, but this number increased to 19 by 2000. Of the 19 mega-cities in the contemporary world, 11 (i.e., 58 per cent) are located in Asia. Indeed, Asia has dominated over other regions in terms of the emergence of large cities in all size categories (see Table 1.4).
Table 1.4 The world’s urban agglomerations, 2001–2015 (>106 inhabitants in 2001)

History has shown, however, that Asia has always been the location of the world’s largest cities. The shift of large cities to North America and Europe during the late 19th and 20th century can be seen as a fluctuation rather than a long-term trend. Figure 1.1 demonstrates that most of the largest 20 cities in the world at different points in time since 1350 BC have been located within Asia. In early times large African cities were located in Egypt, but in later periods large cities appeared in central and southern Africa. Those of early Europe were located in Greece and Italy, but locations changed later to include more Western European countries. Early large Asian cities were first located in Asia Minor, the Middle East, China and South Asia. Between 600 and 800 AD, Japanese and Southeast Asian cities were included in the list of the world’s largest cities. Mexico’s Teotihuacan was included for a brief period. It was not until contemporary times that cities in North, Central and South America had surpassed others in the world. While cities in Europe and North American grew to a large size much more rapidly than their predecessors as a result of the Industrial Revolution, the new millennium will once again see the rise of large cities in Asia (see Chandler 1987).
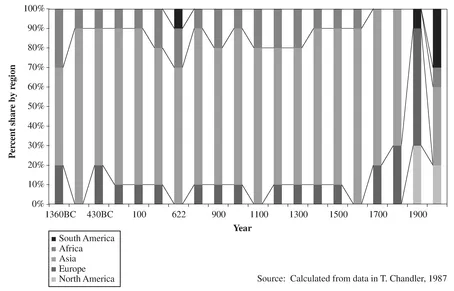
Figure 1.1 Regional shares of world’s 20 largest urban areas, 1360 BC to 2000 AD
The number of large cities will continue to increase in the medium-term. The UN predicts that by 2015, the number of mega-cities will increase to 23 (see Table 1.5). In the next 15 years, however, it is the middle size large cities (i.e., those from 5 to 10 million inhabitants) that will gain the largest numbers and increase in relative size. It is interesting to note that while the proportion of the urban population is expected to dramatically rise, the proportion of those living in mega-cities is not. Large cities are growing more slowly than others. The UN projects that of the total urban population, the mega-cities will continue to maintain a share of approximately 12 per cent in 2030, a fraction of a percentage higher than in 2000. Most of the urban population (approximately 60 per cent) will continue to live in cities with less than 1 million inhabitants.
Table 1.5 Share comparisons of various sized urban regions, 2000 and 2015 (population in thousands)

Local Environmental Issues in Asian Cities
The growth of cities in Asia is not without its challenges. Many cities within the region have significant ‘brown’ agenda issues, including the equitable provision of water supply access and sanitation. These services are tightly linked with adequate housing and poverty. Those without adequate access to these services are often found in slums or squatter settlements and the lack of access to basic infrastructure exacerbates problems associated with low incomes. Indeed, without appropriate infrastructure urban areas are among the world’s most life-threatening human environments and half the urban population in Africa, Asia and Latin America are suffering from one or more of the main diseases associated with inadequate water and sanitation provision (World Health Organization 1999). Water, sanitation and hygiene risks are associated with 2.2 million annual deaths and diarrhea alone causes 6000 deaths per day, mostly among children (UN-Habitat 2003).
Local environmental challenges dominate low-income cities (Hardoy et al. 2001; McGranahan et al. 2001). In Asia the challenges are particularly acute. Table 1.6 presents the numbers of those without access to adequate water supplies and sanitation in Asia. These figures are, indeed, significant. Even though the percentage of those in Asia without adequate infrastructure for these life supporting needs are as high as those in Africa, the absolute numbers in Asia are over three times greater than in Africa or Latin America.
Table 1.6 Estimates for the proportion of people without adequate provision for water and sanitation in urban areas of the developing world
| Region | Number and proportion of urban dwellers without adequate provision | |||
| Water | Sanitation | |||
| Africa | 100–150 million (ca. 35–50 per cent) | 150–180 million (ca. 50–60 per cent) | ||
| Asia | 500–700 million (ca. 35–50 per cent) | 600–800 million (ca. 45–60 per cent) | ||
| Latin America and the Caribbean | 80–120 million (ca. 20–30 per cent) | 100–150 million (ca. 25–40 per cent) | ||
Source: UN-Habitat, 2003
It must be noted that the numbers in Table 1.6 are based upon estimations. Exact comparisons are extremely difficult to make, as there is little agreement as to what constitutes ‘adequate’ living conditions. At the same time, situations have been documented in individual cities that suggest similar results. For example, in many cities of the rapidly developing Asian region, it is not uncommon that large sections of the population use water that is contaminated and have no provision for sanitation in their home (Hardoy et al. 2001). Moreover, even in ‘successful’ cities, such as Bangalore, almost a third of the population is without direct access to water and must draw water from public fountains (ibid).
Many of these cities are surviving on colonial infrastructure that has been taxed beyond limits. Further, the urbanization within Asia that is expected to continue into the early 21st century is largely within the least developed or low-income economies of Asia. These are those governments that have the fewest resources to provide services. One way to assess the scale of the problem is to match projected challenges against what the international community has set as a goal to overcome. Target 10 of the UN Millennium Development Goal 7 seeks to half the proportion of people without sustainable access to safe drinking water and basic sanitation by 2015, and target 11 seeks to achieve a significant improvement in the lives of at least 100 million slum dwellers (defined as people currently without adequate housing and basic services) by 2020. The latter target falls well short of the 924 million people presently estimated living in slums (Payne and Majale 2004). Between 2000 and 2020, the UN predicts that in low and lower-middle income countries in developing Asia alone there will be an additional 364 and 408 million people added to cities (see Table 1.7). Hence, local environmental challenges are significant and will remain so for the region into the foreseeable future.
Table 1.7 Change in urban population within Asia by income status, 2000–2020
| Country status | Countries (n) | Urban population 2000 (in thousands) | Urban population 2020 (in thousands) | Change 2000–2020 (in thousands) |
| Low income | 17 | 450,262 | 814,373 | 364,111 |
| Lower-middle income | 17 | 704,570 | 1,113,529 | 408,959 |
| Upper-middle income | 4 | 36,378 | 61,265 | 24,887 |
| High income | 12 | 160,599 | 176,435 | 15,836 |
Source: The economic data is from the World Bank. Economies are divided according to 2003 GNI per capita, calculated using the World Bank Atlas method. The groups are: low income, $765 or less; lower middle income, $766–$3,035; upper middle income, $3,036–$9,385; and high income, $9,386 or more. (Based on figures available at http://www.worldbank.org/data/countryclass/countryclass.html in October 2004.)
The data on percentage urban are based on United Nations, 1999: World Urbanization Prospects: The 1999 Revision.
POP/BD/WUP/Rev.1999/1/F2, United Nations, New York.
Asian-style Globalization and Global Environmental Challenges
At the end of the 20th century, the world economy experienced structural adjustments affecting production, resource utilization and wealth creation. Cross-border functional integration of economic activities and growing interdependencies among regional economic blocs are part of a set of processes defined as globalization. Evidence for the geographical scope of globalization usually includes the locations of nodes within the flows, while the intensity of globalization is generally given by a number of trend indicators including trade and financial flows, foreign direct investment (FDI), communications (i.e., information flows) and personal and business travel. The increasing scope and intensity of global economic integration has been underpinned by advances in technologies facilitating communications and transportation.
Globalization has not impacted nations evenly. Those in East and Southeast Asia have experienced the rapid development of a manufacturing belt with high accession rates in secondary economic activity and growth. While most of the world’s manufacturing production is still located in OECD countries like the United States, Japan and Western Europe, there have been significant changes in the geography of manufacturing output. In all of the G7 countries, the share of manufacturing in GDP dropped significantly from 1960 to 1993. In the United States from 1979 to 1995, as many as 24.8 million ‘blue-collar’ jobs were extinguished and new employment was not generated in the manufacturing sector. This decrease in manufacturing employment has translated directly into lower production levels. In terms of world share, the manufacturing output from the USA has declined from 34.4 per cent in 1965 to 25.7 per cent in 1992.
With the loss of manufacturing ...
Table of contents
- Cover
- Half Title
- Title
- Copyright
- Contents
- List of Figures
- List of Tables
- List of Contributors
- Foreword - Managing the Future City
- Acknowledgements
- Introduction
- Part I The Challenges of Urban Development Processes
- Part II New Scales in Space and Time
- Part III Transforming State, Space and Society: Political Reform, Promoting Citizens Rights and Poverty Alleviation
- Part IV Coming Together
- References
- Index
Frequently asked questions
Yes, you can cancel anytime from the Subscription tab in your account settings on the Perlego website. Your subscription will stay active until the end of your current billing period. Learn how to cancel your subscription
No, books cannot be downloaded as external files, such as PDFs, for use outside of Perlego. However, you can download books within the Perlego app for offline reading on mobile or tablet. Learn how to download books offline
Perlego offers two plans: Essential and Complete
- Essential is ideal for learners and professionals who enjoy exploring a wide range of subjects. Access the Essential Library with 800,000+ trusted titles and best-sellers across business, personal growth, and the humanities. Includes unlimited reading time and Standard Read Aloud voice.
- Complete: Perfect for advanced learners and researchers needing full, unrestricted access. Unlock 1.5M+ books across hundreds of subjects, including academic and specialized titles. The Complete Plan also includes advanced features like Premium Read Aloud and Research Assistant.
We are an online textbook subscription service, where you can get access to an entire online library for less than the price of a single book per month. With over 1.5 million books across 990+ topics, we’ve got you covered! Learn about our mission
Look out for the read-aloud symbol on your next book to see if you can listen to it. The read-aloud tool reads text aloud for you, highlighting the text as it is being read. You can pause it, speed it up and slow it down. Learn more about Read Aloud
Yes! You can use the Perlego app on both iOS and Android devices to read anytime, anywhere — even offline. Perfect for commutes or when you’re on the go.
Please note we cannot support devices running on iOS 13 and Android 7 or earlier. Learn more about using the app
Please note we cannot support devices running on iOS 13 and Android 7 or earlier. Learn more about using the app
Yes, you can access Managing Urban Futures by Marco Keiner, Martina Koll-Schretzenmayr,Marco Keiner,Willy A Schmid in PDF and/or ePUB format, as well as other popular books in Architecture & Urban Planning & Landscaping. We have over 1.5 million books available in our catalogue for you to explore.