- 344 pages
- English
- ePUB (mobile friendly)
- Available on iOS & Android
eBook - ePub
Spatial Analysis in Health Geography
About this book
Presenting current research on spatial epidemiology, this book covers topics such as exposure, chronic disease, infectious disease, accessibility to health care settings and new methods in Geographical Information Science and Systems. For epidemiologists, and for the management and administration of health care settings, it is critical to understand the spatial dynamics of disease. For instance, it is crucial that hospital administrators develop an understanding of the flow of patients over time, especially during an outbreak of a particular disease, so they can plan for appropriate levels of staffing and to carry out adaptive prevention measures. Furthermore, understanding where and why a disease occurs at a certain geographic location is vital for decision makers to formulate policy to increase the accessibility to health services (either by prevention, or adding new facilities). Spatial epidemiology relies increasingly on new methodologies, such as clustering algorithms, visualization and space-time modelling, the domain of Geographic Information Science. Implementation of those techniques appears at an increasing pace in commercial Geographic Information Systems, alongside more traditional techniques that are already part of such systems. This book provides the latest methods in GI Science and their use in health related problems.
Tools to learn more effectively

Saving Books

Keyword Search

Annotating Text

Listen to it instead
Information
Chapter 1
Introduction: Spatial Analysis and Health
Medical Geography or Spatial Epidemiology is concerned with two fundamental questions: (1) where and when do diseases tend to occur? and (2) why do such patterns exist? The field has experienced substantial growth over the last decade with the widespread recognition that the concept of “place” plays a significant role in our understanding of individual health (Kwan, 2012) while advances in geographical modeling techniques have made it easier to conduct spatial analysis at different granularities, both spatially and temporally (Cromley and McLafferty, 2011). Several journals (for example, Health and Place, Spatial and Spatio-Temporal Epidemiology, International Journal of Health Geographics, Geospatial Health and Environmental Health) have a long tradition to publishing research on topics in Spatial Epidemiology.
This introductory chapter reviews some contemporary themes and techniques in medical geography. Specifically, we discuss the nature of epidemiological data and review the best approaches to geocode and map information while maintaining a certain level of privacy. Analytical and visualization methods can inform public health decision makers of the reoccurrence of a disease at a certain place and time. Clustering techniques, for instance, can inform on whether diseases tend to concentrate around specific locations. We examine the role of the environment in explaining spatial variations of disease rates. Next, we address the importance of accessibility models, travel estimation and the optimal location of health centers to reduce spatial inequalities when accessing health services. We also review the increasing contributions of volunteered geographic information and social networks, helping to raise public awareness of the risk posed by certain diseases, especially vector-borne diseases following a disaster. The concepts of scale and uncertainty are discussed throughout as they are known to affect the suitability of certain methods and consequently impact the stability of the results. Some of the concepts set forth are illustrated with a data set of a 2010 dengue fever outbreak in Cali, Columbia. We conclude this chapter by discussing the layout and contributions of this volume to Spatial Epidemiology.
Mapping Epidemiological Data
Medical geography studies the relationship between place and health; specifically it evaluates how the physical and social environments shape the health and well-being of different individuals (Cromley and McLafferty, 2011). Geographical Information Systems (GIS) and spatial analysis provide unique tools to determine where and when a particular disease has occurred and could resurface in the future. Accurate spatial (and temporal) data is thus critical to identifying such patterns.
Epidemiological data comes at different scales (disaggregated or aggregated data) and different levels of accuracy. Addresses can be transformed into geographic coordinates by means of geocoding (Goldberg, Wilson, and Knoblock, 2007), but the process may be sensitive to the completeness of the addresses and the quality of the underlying network (Zandbergen, 2009; Jacquez, 2012). Scatter maps are used to display geocoded, disaggregated data; for example, in Figure 1.1(a), each dot is an occurrence of a reported dengue fever1 case in Cali, an urban area of Colombia, during an outbreak in 2010 (Delmelle, and Casas et al. 2013). Besides cartographic outputs, GIS can link spatially-explicit data to environmental and census data using one of the available spatial join algorithms. This approach facilitates our understanding on the role that the physical and social environment may play on health and well-being.
Due to privacy concerns, epidemiological data may be geomasked,2 or be aggregated at a certain level of census geography, for instance at the county or postal and zip code level. Figure 1.1(c) uses a proportional symbology to map the variation of dengue cases per neighborhood, suggesting an uneven pattern. Other techniques, such as choropleth mapping, are widely used to display disease rates across an area. Figure 1.1(e) suggests that dengue fever rates are not randomly distributed, possibly owing to population density, shown in Figure 1.1(d).
A concept that has received significant attention in medical geography is the level of spatial scale at which the analysis is conducted (Diez Roux, 2001). As pointed out by Root (2012), “the impact of neighborhoods on health is uniquely geographic.” Spatially aggregating data, however, give rise to the modifiable areal unit problem (MAUP). This is because the basic assumption of any aggregation scheme is that there is uniformity within but sharp contrast among the defined geostatistical areas (Cromley and McLafferty, 2011). Using different boundaries an analysis may lead to significantly different results. It has thus become clear that it is increasingly important to conduct analysis at several granularities of scale.
Visualizing Disease Patterns and Clustering Techniques
Clustering techniques help identify whether disease events are randomly distributed and if not, where clusters may be located. Delimiting the extent of those clusters is important for the determination of areas potentially at risk. In this context, the contributions of exploratory spatial data analysis (ESDA), including kernel density estimation (KDE), are well documented in the literature (Delmelle et al., 2011; Delmelle, 2009; Cromley and McLafferty, 2011; Kulldorff, 1997). Eisen and Eisen (2011) and Vazquez-Prokopec et al. (2009) underline the importance of GIS and ESDA to monitor vector-borne diseases, where prompt space-time monitoring techniques are critical for timely detection and mitigation purposes. Spatial analytical methods can generate disease distribution maps revealing significant information in terms of direction, intensity of a disease, as well as its likelihood to spread to inhospitable areas.
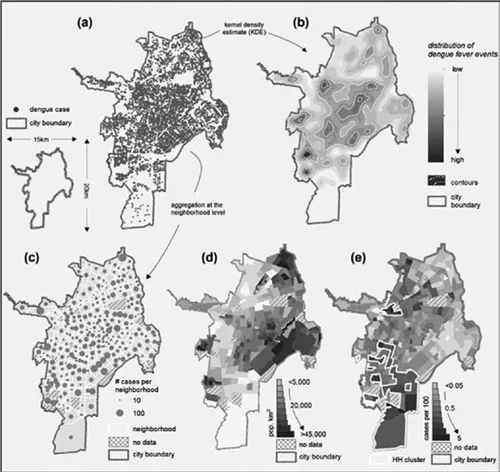
Figure 1.1 Dengue fever cases for the city of Colombia, 2010 (geocoded at the street intersection level), in (a). Kernel density estimation in (b), aggregated dengue cases per neighborhood in (c), population density in (d) and dengue fever rates in (e)
The ESDA techniques are used traditionally to identify spatial and more recently spatio-temporal patterns. The statistical significance of identified clusters is tested by Monte Carlo simulations. Kulldorff et al. (1998) and Levine (2006) have developed spatial analytical tools (SatScan and CrimeStat, respectively) to detect clusters of point events and then to conduct simulations for the evaluation of the statistical significance of those clusters. Such tools are now incorporated into commercial GIS packages and are available to the common GIS user (Fischer and Getis, 2009). An example of an ESDA technique is the kernel density estimation, illustrated in Figure 1.1(b) for monitoring hot spots of dengue fever. In essence, the map shows areas with greater expectation of dengue fever occurrences. Contours reinforce the extent of such hot spots.
Space-time clustering techniques are still in their development phase, partly due to their computational challenges (Jacquez, Greiling, and Kaufmann, 2005; Robertson et al., 2010). Research on space-time clustering tests has focused mainly on uncertainty, which is introduced through biased or incomplete data, perhaps because of incorrect addresses or inaccurate reported diagnosis (Lam, 2012; Malizia, 2012). Within the limits imposed by computational requirements, much recent research attempts to remedy weaknesses in visualization techniques (Delmelle et al., 2014a).
Nearby observations may exhibit similarity (Tobler, 1970). Spatial autocorrelation, estimated by a global Moran’s I statistic (Moran, 1950), measures whether nearby data (generally aggregated) are dependent on one another, while its local statistic counterpart (Anselin, 1995) informs on where those clusters of similar observations tend to occur. For the neighborhood data, for example, shown in Figure 1.1(e), the estimated Moran’s I value is 0.14, indicating a weak autocorrelation. The Moran’s I statistic can be extended in time to detect space-time autocorrelation (Goovaerts and Jacquez, 2005).
Environment and Health
Geographers, statisticians and public health experts have not only focused on the detection of spatial clusters of diseases, but also on the evaluation of the association of natural factors and the built environment with health and individual well-being. The hypothesis here is that geographic behaviors and outcomes of health (that is, health disparities) cannot only be explained by individual factors; neighborhood factors are likely to play a contributing role (Diez Roux, 2001; Krieger et al., 2003). For instance, individuals living in rural regions will experience geographic barriers in traveling to health services, given that the numbers of facilities that can be reached within a certain time budget is much smaller than in urban areas. Women living in poor areas may find it particularly difficult to access mammography facilities when they do not have a vehicle and must rely on public transportation (Peipins et al., 2011). Children walking to schools or living in an environment where parks and playgrounds are readily accessible may be prone to be more active than others (Cooper et al., 2010). Clusters of violence in urban neighborhoods may be related to alcohol outlets (Grubesic and Pridemore, 2011). These examples illustrate the breadth of pathways through which environmental factors give rise to health disparities over space.
Other non-neighborhood factors may play an important role in shaping our understanding of the potential for outbreaks of certain diseases. As suggested by Comrie (2007), climatic variation and weather-related factors is likely to create particularly suitable conditions for certain vectors to thrive and potentially increase the geographical extent of vector-borne diseases. Spatial regression and multilevel modeling are examples of some of the key methods that were developed for the evaluation of the impact of neighborhoods on health (Cromley and McLafferty, 2011). Variation in the dependent variable (disease rate, accessibility) can be explained by a set of individual characteristics (age, gender, income and education for instance), environmental factors (neighborhood characteristics) and spatial terms accounting for the presence of spatial autocorrelation. Geographically Weighted Regression quantifies the spatial importance of each explanatory variable on the dependent variable (Fotheringham, Brunsdon, and Charlton, 2003).
What defines a neighborhood and the concept of scale will affect which methodology is used and ultimately the results. Krieger et al. (2003) underline that the geographic scale of secondary data, such as socio-economic characteristics, may determine the level of aggregation at which a study is conducted. Evaluating the effect of different artificial boundaries is thus necessary by repeating those analyses at different scales. Using only the local scale of a neighborhood may not account for the entire activity space of an individual (Cummins, 2007). GPS and GIS technologies appear to be particularly useful in mapping the daily activity of individuals and determining the extent of an individual’s neighborhood (Kwan, 2004). Also, in studies of exposure analysis it is important to take account of the residential history of subjects under study, although relevant data are not always available (Root, 2012).
Health Care Provisions and Accessibility
Accessibility is a critical element of any health care system. In an ideal system, every member of a community should have similar access to health care professionals; however, a perfect match between supply and demand is not possible, leading to spatial inequalities (Cromley and McLafferty, 2011; Parker and Campbell, 1998). In rural areas, for instance, access to care is constrained due to longer travel distances and scarcity of providers.
A critical objective of a health care system is to guarantee a minimum level of geographic access to primary care services. Accessibility below that level can make the difference between life and death or between a controlled outbreak and an epidemic (Higgs, 2004). Travel impedance is thus a contributing factor in the utilization of health care services (Lovett et al., 2002; Delamater et al., 2012). Impedance can be evaluated with different metrics such as travel distance (Euclidean or network), or travel time. The latter may be a more precise measure since it accounts for en-route conditions (Cromley and McLafferty, 2011). Delmelle and Cassell et al. (2013) propose a GIS-based methodology to estimate travel impedance for children with birth defects, suggesting that children living in urban areas have a much lower travel burden than children in rural areas. Having to rely on public transportation, urban residents of low-income areas may be at a disadvantage. Several internet-based providers (Open Street Map, GoogleMaps) can estimate travel impedance; however, when using those providers, careful attention must be paid to confidentiality issues, the accuracy of the travel estimates themselves and the restriction in the number of queries that can be submitted to those providers.
One way of visualizing health care accessibility is by means of KDE, as discussed in previous sections of this introduction. In this case, one can estimate the density of service providers over space, revealing differences in access (Lewis and Longley, 2012; Casas, Delmelle, and Varela, 2010). Another popular approach is the two-step floating catchment area (Luo and Wang, 2003) which evaluates the availability of health services in regards to population need. Methods based on gravity models can capture the interaction of an individual with a health facility, using several of its characteristics, including size and quality of service. Nevertheless, these aforementioned approaches remain theoretical in nature. Although more difficult to obtain due to confidentiality concerns, revealed accessibility provides actual information on the utilization of health services, allowing the identification of facilities that are underutilized or overutilized while delimiting the catchment area of any facility. It is therefore desirable for researchers to obtain information on the utilization of health services at a disaggregated level.
Disparities in geographical accessibility can be reduced by selecting the optimal location and capacity for new health centers or when existing facilities are to be upgraded or their size calibrated (Wang, 2012). Operations Research and Location-Allocation Modeling are proven techniques that effectively answer questions as to where new facilities should be opened and of what capacity in order to maximize coverage and minimize travel. More behavioral research is needed coupled with simulation modeling regarding the utilization of health care services following a change in the structure of a network of facilities.
Volunteered Geographic Information
Boulos et al. (2011) discuss the increasing interest among health researchers to disseminate analytical functionality over the internet, partly due to the massive epidemiological datasets that are becoming available through social networks, such as twitter (Frei...
Table of contents
- Cover Page
- Title Page
- Copyright Page
- Contents
- List of Figures
- List of Tables
- Notes on Contributors
- Acknowledgements
- 1 Introduction: Spatial Analysis and Health
- SECTION 1 METHODS
- SECTION 2 INFECTIOUS DISEASE
- SECTION 3 CHRONIC DISEASE
- SECTION 4 EXPOSURE
- SECTION 5 ACCESSIBILITY AND HEALTH
- Appendix
- Index
Frequently asked questions
Yes, you can cancel anytime from the Subscription tab in your account settings on the Perlego website. Your subscription will stay active until the end of your current billing period. Learn how to cancel your subscription
No, books cannot be downloaded as external files, such as PDFs, for use outside of Perlego. However, you can download books within the Perlego app for offline reading on mobile or tablet. Learn how to download books offline
Perlego offers two plans: Essential and Complete
- Essential is ideal for learners and professionals who enjoy exploring a wide range of subjects. Access the Essential Library with 800,000+ trusted titles and best-sellers across business, personal growth, and the humanities. Includes unlimited reading time and Standard Read Aloud voice.
- Complete: Perfect for advanced learners and researchers needing full, unrestricted access. Unlock 1.4M+ books across hundreds of subjects, including academic and specialized titles. The Complete Plan also includes advanced features like Premium Read Aloud and Research Assistant.
We are an online textbook subscription service, where you can get access to an entire online library for less than the price of a single book per month. With over 1 million books across 990+ topics, we’ve got you covered! Learn about our mission
Look out for the read-aloud symbol on your next book to see if you can listen to it. The read-aloud tool reads text aloud for you, highlighting the text as it is being read. You can pause it, speed it up and slow it down. Learn more about Read Aloud
Yes! You can use the Perlego app on both iOS and Android devices to read anytime, anywhere — even offline. Perfect for commutes or when you’re on the go.
Please note we cannot support devices running on iOS 13 and Android 7 or earlier. Learn more about using the app
Please note we cannot support devices running on iOS 13 and Android 7 or earlier. Learn more about using the app
Yes, you can access Spatial Analysis in Health Geography by Pavlos Kanaroglou,Eric Delmelle in PDF and/or ePUB format, as well as other popular books in Physical Sciences & Geography. We have over one million books available in our catalogue for you to explore.