![]()
Part I
Overview of M&As and Executive Compensation
Part Contents:
Chapter 1. M&A Activities: Global Portrait and Merger Motives
Chapter 2. Incentive Design of Executive Compensation Packages
Chapter 3. Conceptual Framework Linking M&As With Executive Compensation
![]()
1 M&A Activities
Global Portrait and Merger Motives
Updated Portrait of Global M&A Activity
M&As as High-Profile Events
Corporate restructuring strategies are presently at the center of a heated debate, and myriad leading topics related to mergers and acquisitions (M&As) figure prominently among central business policy issues. What continuously surprises the public is the unwavering popularity of M&As, as in 2007, organizations merged and acquired across the globe at an all-time record level of US$5.58 trillion (Zephyr, 2008), while the bulk of empirical studies show that many of these transactions fail to produce the expected benefits to the shareholders of acquiring companies (Girma, Thompson, & Wright, 2006). In the aftermath of the financial recession of 2008, the global M&A activity declined, registering a total of 72,356 and 67,183 deals valued at US$3.77 and US$3.38 trillion in the years 2009 and 2010, respectively (Zephyr, 2012). However, the number and value of M&A transactions soon started rising again due to the burgeoning signs of economic recovery and the increased investors’ confidence in many regional markets. According to the latest Zephyr Annual M&A Report, as many as 71,811 deals worth US$3.45 trillion were conducted in the world during 2013 (Zephyr, 2014a).
Having emerged at the end of the 19th century, M&A deals became over the years an important and dramatic phenomenon that brings about numerous socioeconomic consequences in terms of financial worth, legal considerations, and number of affected stakeholders. These transactions may implicate direct competitors or acquisitions of a firm’s major supplier/distributor (i.e., horizontal versus vertical deals), companies operating in the same or completely different industries (i.e., concentric versus conglomerate deals), and bidders and targets originating from the same or different countries (i.e., domestic versus cross-border deals). M&As currently represent a dominant growth strategy for many corporations due to the increasing globalization trend and particularly in an environment where opportunities for pursuing organic growth are scarce (Galpin & Herndon, 2014). Some transactions are worth astronomical amounts of money, while others result in the creation of the largest corporate entities in their industries of operation. The top deal in global M&A history, which involved Vodafone AirTouch, a British telecommunication company, and Mannesmann, a German telephone and Internet firm, was valued at US$172 billion including debt when it was completed in 2000 (Rocco, 2013). Anheuser–Busch InBev, which ensued from the 2008 merger between the Belgian-Brazilian InBev and the American Anheuser–Busch, continues to be the largest beer company in the world (Kim, Nofsinger, & Mohr, 2010).
M&As are high-profile and complex events that imply substantial wealth movements between the parties concerned, requiring the assistance of specialized professionals such as financial consultants (e.g., Goldman Sachs, Morgan Stanley, Bank of America Merrill Lynch) and legal advisors (e.g., Shearman & Sterling, Davis Polk & Wardell). The conduct of M&A deals is typically associated with multiple risks of a operational, strategic, financial, reputational, and cultural nature (Asimakopoulos & Athanasoglou, 2013). The target and acquiring firms may incur significant integration problems, which often result in high failure rates and a huge waste of organizational resources. For instance, America Online’s takeover of Time Warner is commonly viewed as one of the worst transactions ever concluded, leading to the official separation of the two companies nine years after the initial agreement (Rocco, 2013). Time Warner Cable Inc. is presently sought to be acquired by the American Comcast Corporation at an announced value of US$68.94 billion (Zephyr, 2014b). Nonetheless, despite the potential merger-induced hazards and difficulties occurring in integrating firms, M&As continue to occur at high levels, which may be conducive toward the attainment of new heights in terms of frequency and estimated value (Hammond, 2014).
The First Five Merger Waves
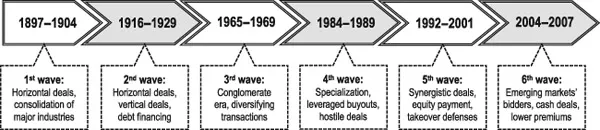
It is generally agreed that M&A activity comes in waves as a result of a combination of economic, technological, and regulatory shocks that determine the rate and intensity of corporate acquisitive behavior (Andrade, Mitchell, & Stafford, 2001). Recent studies show that merger waves are caused by stock market booms (Polemis & Paleologos, 2014) and are diffused over the wider economy from industries that occupy a central position in customer-supplier networks (Ahern & Harford, 2014). Scholars identify six merger waves (see Figure 1.1) that took place in the United States of America (USA), each of them being demarcated by a distinctive logic and featuring specific characteristics (Bodolica & Spraggon, 2009a; Gaughan, 2007). The statistical data on global M&A activities over the recent years, which are illustrated later in this chapter, may be indicative of another merger wave, but this contention has yet to be confirmed. The first wave recorded many horizontal transactions and consolidation of petroleum, chemicals, food, transportation equipment, and metal industries, resulting in a monopolistic market structure. Reporting a value creation of 12 to 18 percent for bidding and target firms, Banerjee and Eckard (1998) posit that acquisitions from this wave were more consistent with efficiency rationales rather than monopoly power considerations.
Figure 1.1 Distinctive characteristics of the different merger waves
The consolidation trend continued into the second merger wave, creating an oligopolistic industry structure, with many horizontal and vertical deals being financed through the use of debt. According to Leeth and Borg (2000), the observed abnormal returns of zero and 15 percent to acquiring and target shareholders, respectively, were not driven by industry relatedness, acquisition mode, and method of payment. The conglomerate era demarcated the third wave as companies started to diversify their core businesses purchasing targets from different industries (Bodolica & Spraggon, 2009a). Bidders’ wealth benefits extracted from diversifying deals of the 1960s could be explained by expectations of internal capital markets’ efficiency and complementary expertise-related effects of merging firms, where the target provided operational information and the bidder contributed the financial capital (Hubbard & Palia, 1999). Because many conglomerates ultimately failed, American corporations started to look for greater specialization in the fourth merger wave, which is also characterized by higher levels of hostile takeovers and leveraged buyouts (Holmstrom & Kaplan, 2001).
Hence, the first four merger waves spread over a period of 100 years to come to an end in 1989, evolving from consolidating and debt-financed acquisitions to more diversified and hostile deals (Bodolica, 2013). According to Weston and Chen (1994), this period has witnessed an important shift from an era of heavy leveraging as a mechanism to discourage takeover attempts to an entirely new epoch of financial restructuring and equitizing. Mergers from the fifth wave were undertaken for strategic reasons to expand into new markets or to take advantage of perceived synergies and were associated with greater use of equity mode of financing and antitakeover defenses (Moeller, Schlingemann, & Stulz, 2005). Apart from these prevailing features, the whole period of the 1990s is labeled as the “mega-merger mania” decade, when all the records registered in the previous merger waves were beaten (Hitt, Harisson, & Ireland, 2001). More than 10 transactions were taking place daily in the USA during 2000, the year that has also witnessed the largest deal (by announced value) ever not only in American history but also worldwide. This was the mega-merger between America Online (AOL) and Time Warner worth US$186 billion at the time the deal was announced (Bloomberg, 2013).
The fifth merger wave came to its end in 2001 as the number of M&A deals declined significantly due to the collapse of the stock market and global downturn. The period of relative stagnancy in M&A activity that followed, particularly in the USA, can be explained by various events such as the 9/11 attacks, uncertainty over the war in Iraq, and higher risk aversion on the part of American executives in the wake of huge corporate failures (e.g., Enron, WorldCom) and new corporate governance reforms (i.e., Sarbanes-Oxley Act; Hansen, 2004). However, as statistical data show, this pause ended in 2004, when acquisitions started to occur again very frequently at a global scale, reaching unprecedented levels in 2007. About 73,000 deals took place in the world during 2007, with a total value exceeding US$5.5 trillion—numbers that are significantly higher than the 55,342 deals worth US$2.41 trillion registered in 2004 (Zephyr, 2008).
The Sixth Merger Wave
The 2004 to 2007 period demarcated the sixth merger wave, which is unique not only in terms of record numbers and values of completed transactions but also in that M&As became a global phenomenon occurring more regularly outside the USA (Gregoriou & Renneboog, 2007). The empirical evidence suggests that this wave featured a less competitive market for corporate control, higher availability of liquidity, lower rates of acquirers’ acquisitiveness, less overvaluation of acquiring firms relative to targets, smaller size of acquisition premiums, larger cash components in deals’ financing, and more rationality and cautiousness with regard to M&A–related decisions (Alexandridis, Mavrovitis, & Travlos, 2012). The European Union (EU) member states played a determinant role during the sixth wave, as M&As in Europe reached higher levels than those registered in the USA. The creation of the Euro Zone in 2002 and the enlargement of the EU in 2004 to include 10 new members from Central and Eastern Europe have been critical factors facilitating merger activities in this region (Campa, 2006). A total of 23,010 deals of a combined value of US$1.96 trillion were conducted in Europe in 2007 (29,699 deals and US$1.58 trillion in 2006), while these figures equaled 18,042 deals and US$1.84 trillion in the USA and Canada (Zephyr, 2008). During the 1995 to 2007 period, the European merger market revealed some distinctive characteristics such as the prevalence of domestic, private, and cash-financed transactions, an increase in intra-European deals, very low levels of hostility and competing bids, weaker role played by financial investors, a tendency toward national industry consolidation, and an insignificant influence of industry regulation on M&A completion (Moschieri & Campa, 2014).
With a spectacular number of 18,802 deals completed in 2007 worth US$1.02 trillion (compared to the modest 2003 levels of 7,702 and US$279 billion, respectively), companies from the Asia Pacific region have also emerged as important players in the M&A landscape. Transactions that occurred in the rest of the world (including Latin America, Africa, the Middle East, and Russia) followed the same pattern, hitting the all-time high in 2007 with 12,359 deals of a total value of US$698 billion (against 5,176 deals and US$200 billion in 2003). In Russia alone, M&A deals during the year 2007 were concluded at a rate of one per day, with a total value of US$80 billion (Mergemarket, 2009). The significant increase in M&A activities in these less mature markets was possible due to the massive wave of privatization of state-owned enterprises that took place in the late 1990s, allowing the released-from-governmental-control companies to more freely pursue their own M&A strategies.
Another prominent characteristic of the sixth merger wave is the appearance of the emerging market bidder (Gaughan, 2007). One example is the US$12 billion acquisition of British-owned Corus Group by Indian Tata Steel in January 2007, which is the largest Indian takeover of a foreign firm, making Tata Steel the fifth-largest steel maker in the world (IndiaPRwire, 2007). Another is Dubai Ports World’s US$6.8 billion takeover of Peninsular & Oriental Steam Navigation Co. completed in 2006, which turned the company into one of the world’s three largest ports operators (Goldstein, 2006). Although due to the recent financial crisis the global M&A numbers in 2008 (with 68,363 deals worth US$4.22 trillion) were brought down to levels not seen since 2004 (Zephyr, 2012), analysts suggest that emerging markets are and will continue to be the major drivers of M&A activity during these times of economic turmoil. Indeed, because of the prevalence of cash-rich privately owned firms in Middle East, this region outperformed global M&A trends in 2008, as its deal numbers and values grew by approximately 40 percent (Singh, 2009).
Most Recent Global M&A Data
During the first half of 2014, a total of 35,429 transactions worth an estimated US$2.03 trillion took place across the globe (Zephyr, 2014b). Although the number of undertaken deals stood at comparable levels, their financial value was the highest recorded for the last nine half-year periods. According to Hammond (2014), the value of M&As reached US$2.66 trillion in the first three quarters of 2014, representing a 60 percent upsurge on the same period in the previous y...