- English
- ePUB (mobile friendly)
- Available on iOS & Android
eBook - ePub
Fiscal Politics
About this book
NONE
Tools to learn more effectively

Saving Books

Keyword Search

Annotating Text

Listen to it instead
Information
Publisher
INTERNATIONAL MONETARY FUNDYear
2017eBook ISBN
9781475547900Part I: Elections, Ideology, and Political Fragmentation
Chapter 2: Governments and Promised Fiscal Consolidations: Do They Mean What They Say?
Introduction
Several reasons could explain why fiscal outcomes may deviate from plans. First, the macroeconomic scenario may unfold differently from that foreseen in the plan (Frankel 2011). Second, the design of fiscal rules may be such that adherence to them requires fiscal discipline in plans but not in outcomes. Finally, policymakers may find it difficult to implement fiscal plans because of opposition from vested interest groups (Beetsma, Giuliodori, and Wierts 2009; von Hagen 2010). In fact, political factors can be particularly important in explaining fiscal outcomes when elections are approaching or if political fragmentation is large (Perotti 1998; von Hagen, Hallet, and Strauch 2001; Perotti and Kontopoulos 2002; Protrafke 2011).1
The difference between budget plans and budget implementation is labeled the promise gap. The size of promise gaps has a bearing on credibility and democratic accountability of elected governments. For example, large and systematic fiscal promise gaps may increase uncertainty for economic agents and lower the credibility of the government, thus increasing long-term interest rates on government bonds (Baldacci and Kumar 2010; Beetsma and others 2015). In addition, when governments do not deliver on their promises, the quality of democracy may suffer (Przeworski and others 1999). In a fully functioning democracy with rational, forward-looking voters and politicians, the electorate expects governments to be responsive to their economic and fiscal preferences.
This chapter studies two questions: First, what explains fiscal consolidation promise gaps? Second, what is the reaction of markets and voters to promise gaps incurred by incumbent parties? This chapter holds the view that these two issues are interrelated. Parties in government are motivated by specific policy agendas and by their willingness to remain in office (Müller and Strom 1999).2 When governments deliver on their promised policies they are likely to be reelected. If they fall short on these promises, they could be penalized by voters unless this deviation benefits the electorate in the short term. At the same time, financial markets monitor these actions, and if they see politically motivated deviations from promised fiscal discipline, they react negatively.
Because these questions are intertwined, the analysis tackles them empirically in two steps. For this purpose, a new database of fiscal consolidations was created that compares narrative budget plans with actual fiscal performance in 17 Organisation for Economic Co-operation and Development (OECD) countries during 1978–2015.3 We find that fiscal promise gaps were sizable (about 0.3 percent of GDP per year, or 1.1 percent of GDP over a typical three-year adjustment episode). Economic factors and forecast errors are important in explaining the differences between budget plans and fiscal outcomes, but political factors also play a role: greater electoral proximity, stronger political cohesion, and higher accountability were all associated with smaller promise gaps. Finally, governments that delivered on their promised fiscal consolidation plans were rewarded by financial markets and not penalized by voters.
This chapter makes three contributions to the existing literature: first, it updates the narrative database from Devries and others (2011) and Alesina and others (2015); second, it considers simultaneously the role of three political factors (electoral proximity, political strength, and institutional accountability) in explaining consolidation promise gaps; and third, it examines the consequences of promise gaps on market sentiment and government popularity among the electorate.
The remainder of the chapter is organized as follows; the second section briefly discusses the data and the definition of the dependent variable. The third section explores the economic and political causes of consolidation promise gaps. The fourth section looks into the reaction of markets and the electorate to these gaps. The fifth section inspects the consequences of consolidation promise gaps. The last section concludes and presents policy implications.
Defining Fiscal Promise Gaps
Identifying Fiscal Consolidation Episodes
The literature on fiscal adjustment episodes is vast and for a long time has relied on the positive approach, by which fiscal consolidations are associated with large changes in the cyclically adjusted primary balance (CAPB).4 More recently, scholars have identified consolidation episodes following a narrative approach, which relies on approved budget plans and historical accounts of past fiscal policy. Such an approach was first popularized by Romer and Romer (2010) and Devries and others (2011), who subsequently made publicly available a list of fiscal consolidation episodes for 17 advanced economies between 1978 and 2009.5 More recently, Alesina and others (2015) updated that database for a subset of European countries through 2012. This chapter updates the database for all 17 countries included in Devries and others (2011). It follows the same approach, and relies on historical description surrounding changes in budget deficits every year as recorded in national budget laws, the European Commission’s Stability and Convergence Programs, and the OECD’s country reviews.6
In this sample, 73 episodes of fiscal consolidations are identified. Table 2.1 summarizes these episodes by country. The number of fiscal contractions per country ranges from two in Canada and Finland, to seven in France and the United States. The size of fiscal consolidation episodes varies from 0.04 percent of GDP to 4.74 percent of GDP, with an average size of fiscal adjustment equal to 1.06 percent of GDP. The average duration of the reported fiscal episodes is 3.3 years, with the shortest duration corresponding to 1 year (21 episodes) and the longest duration corresponding to 14 years (Canada).
Table 2.1. Fiscal Consolidation Years, 17 Advanced Economies, 1978–2015
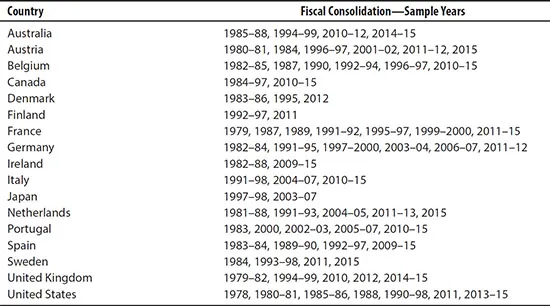
Source: Authors’ calculations.
Note: See Annex 2.1 for details.
Figures 2.1 and 2.2 show the distribution of fiscal consolidation episodes over time as well as their distribution by size (in percentage of GDP). Most episodes took place in the mid-1980s; the late 1990s (led by European countries’ need to qualify for the single currency union); and between 2010 and 2015, in the aftermath of the recent financial crisis (following the cross-country coordinated fiscal stimuli that took place). In more than 35 percent of fiscal adjustment episodes, the size was between 0 and 0.5 percent of GDP. In only 5 percent of cases was the adjustment larger than 3 percent of GDP.
Figure 2.1. Absolute Frequency of Fiscal Consolidation Episodes over Time, 1978–2015
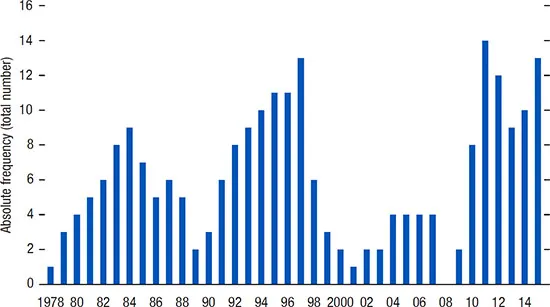
Source: Authors’ calculations.
Figure 2.2. Relative Frequency of Fiscal Consolidation Episodes, by Size of Consolidation
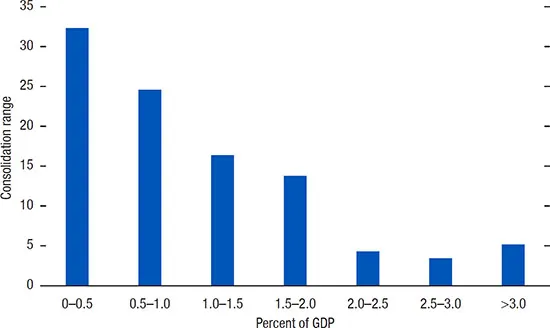
Source: Authors’ calculations.
Measuring Consolidation Promise Gaps
Consolidation promise gaps (CPGs) are defined as the difference between th...
Table of contents
- Cover Page
- Title Page
- Copyright Page
- Contents
- Foreword
- Acknowledgments
- Contributors
- INTRODUCTION
- PART I | ELECTIONS, IDEOLOGY, AND POLITICAL FRAGMENTATION
- PART II | INSTITUTIONS, RULES, AND FISCAL COUNCILS
- PART III | SUPRANATIONAL FISCAL POLITICS
- Index
- Footnotes