NONE
eBook - ePub
World Economic Outlook, April 2007 : Spillovers and Cycles in the Global Economy
- English
- ePUB (mobile friendly)
- Available on iOS & Android
eBook - ePub
World Economic Outlook, April 2007 : Spillovers and Cycles in the Global Economy
About this book
Trusted by 375,005 students
Access to over 1.5 million titles for a fair monthly price.
Study more efficiently using our study tools.
Information
Publisher
INTERNATIONAL MONETARY FUNDeBook ISBN
9781589066267
Year
2006CHAPTER 1 GLOBAL PROSPECTS AND POLICY ISSUES
Notwithstanding recent financial market nervousness, the global economy remains on track for continued robust growth in 2007 and 2008, although at a somewhat more moderate pace than in 2006 (Figure 1.1). Moreover, downside risks to the outlook seem less threatening than at the time of the September 2006 World Economic Outlook, as oil price declines since last August and generally benign global financial conditions have helped to limit spillovers from the correction in the U.S. housing market and to contain inflation pressures. Nevertheless, recent market events have underlined that risks to the outlook remain on the downside. Particular concerns include the potential for a sharper slowdown in the United States if the housing sector continues to deteriorate; the risk of a deeper and more sustained retrenchment from risky assets if financial markets continue to be volatile; the possibility that inflation pressures may revive as output gaps continue to close, particularly in the event of another spike in oil prices; and the low probability but high cost risk of a disorderly unwinding of large global imbalances. From a longer-term perspective, a number of trends—including the aging of populations, rising resistance to increasing globalization, and the environmental consequences of rapid growth—could undermine the buoyant productivity that has underpinned recent favorable outcomes. While remaining vigilant to short-term macroeconomic risks, policymakers should take advantage of the continuing strong performance of the global economy to press ahead with more ambitious efforts to tackle deep-seated structural challenges.
Global Economic Environment
The global economy expanded vigorously in 2006, growing 5.4 percent—¼ percentage point faster than anticipated at the time of the September 2006 World Economic Outlook (Table 1.1 and Figure 1.2). Activity in the United States faced strong headwinds from a sharp downturn in the housing market, while corporate investment in plant and equipment has also softened.
Figure 1.1. Global Indicators1
(Annual percent change unless otherwise noted)
The global expansion remains above trend, although the pace is moderating, helping to contain inflationary pressures. World trade continues to grow significantly faster than output.
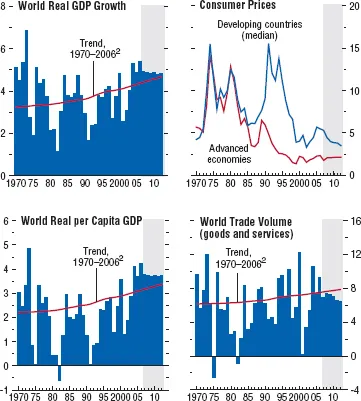
1Shaded areas indicate IMF staff projections. Aggregates are computed on the basis of purchasing-power-parity (PPP) weights unless otherwise noted.
2Average growth rates for individual countries, aggregated using PPP weights; the aggregates shift over time in favor of faster-growing countries, giving the line an upward trend.
Figure 1.2. Current and Forward-Looking Indicators
(Percent change from a year ago unless otherwise noted)
Industrial production and trade indicators suggest that the pace of global expansion has eased somewhat since mid-2006, although generally positive readings on confidence continue to augur well for short-term prospects.
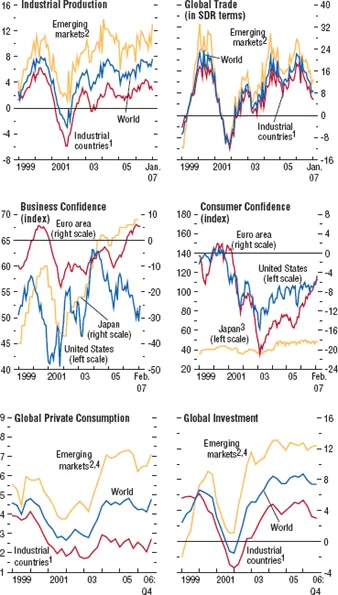
Sources: Business confidence for the United States, the Institute for Supply Management; for the euro area, the European Commission; and for Japan, Bank of Japan. Consumer confidence for the United States, the Conference Board; for the euro area, the European Commission; and for Japan, Cabinet Office; all others, Haver Analytics.
1Australia, Canada, Denmark, euro area, Japan, New Zealand, Norway, Sweden, Switzerland, the United Kingdom, and the United States.
2Argentina, Brazil, Bulgaria, Chile, China, Colombia, Czech Republic, Estonia, Hong Kong SAR, Hungary, India, Indonesia, Israel, Korea, Latvia, Lithuania, Malaysia, Mexico, Pakistan, Peru, the Philippines, Poland, Romania, Russia, Singapore, Slovak Republic, South Africa, Taiwan Province of China, Thailand, Turkey, Ukraine, and Venezuela.
3Japan’s consumer confidence data are based on a diffusion index, where values greater than 50 indicate improving confidence.
4Data for China, India, Pakistan, and Russia are interpolated.
Table 1.1. Overview of the World Economic Outlook Projections
(Annual percent change unless otherwise noted)
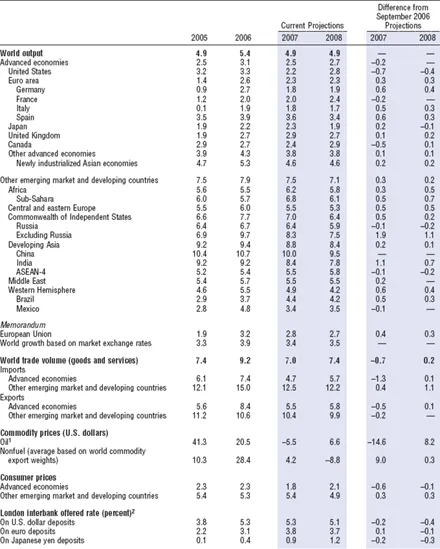
Note: Real effective exchange rates are assumed to remain constant at the levels prevailing during January 26–February 23, 2007. See the Statistical Appendix for details on groups and methodologies.
1 Simple average of spot prices of U.K. Brent, Dubai, and West Texas Intermediate crude oil. The average price of oil in U.S. dollars a barrel was $64.27 in 2006; the assumed price is $60.75 in 2007 and $64.75 in 2008.
2 Six-month rate for the United States and Japan. Three-month rate for the euro area.
However, consumption was sustained by continued employment growth (especially in the services sector) and oil prices declining from August highs. In the euro area, growth accelerated to its fastest pace in six years as domestic demand was boosted by increasing business confidence and improving labor markets, as well as special factors—including the Soccer World Cup and the boost to consumption in advance of a value-added tax (VAT) increase in Germany in January 2007. Activity in Japan slowed in the middle of the year, but regained traction toward year-end.
Rapid growth in emerging market and developing countries was led by China and India. China’s growth rate reached 10¾ percent in 2006, driven by investment and export growth, notwithstanding some easing in the second half as policy tightening helped to cool the pace of fixed asset investment. India’s expansion picked up momentum in the course of the year, with year-on-year growth rising to 9¼ percent. Elsewhere, growth was also generally sustained at robust rates, supported by high commodity prices and favorable financial conditions.
Strong growth and rising international oil prices in the first half of 2006 raised concerns about inflation, but pressures moderated in the second half, dampened by monetary policy tightening and the turnaround in oil markets (Figure 1.3). The oil price declines from August largely reflected some easing of security tensions in the Middle East, improved supply-demand balance in oil markets, and favorable weather conditions in the second half of 2006 (Appendix 1.1). In the advanced economies, headline CPI inflation dropped quite sharply after the summer as fuel costs fell. The core CPI inflation rate (excluding food and energy) also eased modestly in the United States, although remaining somewhat above the Federal Reserve’s implicit comfort zone. The Fed has kept the Federal funds rate on hold since June, seeking to balance risks from a cooling economy and continuing concerns about inflation. In Japan, downward revision of the CPI series has left inflation readings still uncomfortably close to zero, and the Bank of Japan has raised its policy interest rate only very gradually since exiting its zero interest rate policy in July 2006. The European Central Bank (ECB), the Bank of England, and other central banks in Europe have continued to remove monetary accommodation in the context of economic buoyancy. Some emerging market countries—including China, India, and Turkey—have tightened monetary conditions in the face of concerns about over-rapid growth, overheating, and (in the case of Turkey) external pressures, but, overall, inflation outcomes have continued to be favorable.
Figure 1.3. Global Inflation
(Annualized percent change of three-month moving average over previous three-month average, unless otherwise noted)
Measures of inflation and inflation expectations have generally moderated since mid-2006, helped by falling oil prices and some tightening of monetary conditions.
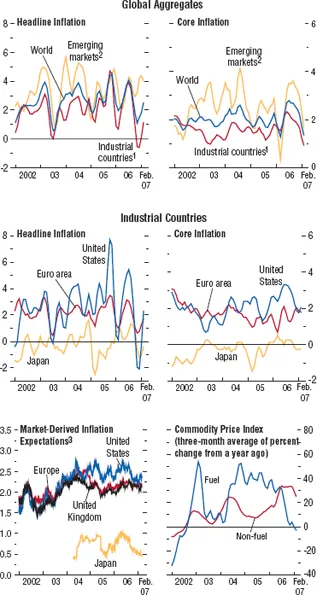
Sources: Haver Analytics; and IMF staff calculations.
1Australia, Canada, Denmark, euro area, Japan, New Zealand, Norway, Sweden, the United Kingdom, and the United States.
2Brazil, Bulgaria, Chile, China, Estonia, Hong Kong SAR, Hungary, India, Indonesia, Korea, Malaysia, Mexico, Poland, Singapore, South Africa, Taiwan Province of China, and Thailand.
3In percent; nominal minus inflation-indexed yields on 10-year securities.
Expectations of continued solid economic growth and fading inflation concerns contributed to buoyant global financial market conditions over most of the period since mid-2006. Markets have been more volatile since late February, but this recent episode seems to be more of a modest correction after a period of rising asset prices, rather than a fundamental change in market sentiment (see the April 2007 Global Financial Stability Report for further details). Notwithstanding recent declines, advanced economy equity markets remain close to all-time highs, supported by strong earnings growth (Figures 1.4 and 1.5). Long-term bond yields have generally receded since mid-2006, spreads on risky assets have narrowed in most market segments, and market volatility was extremely low until recently. Emerging bond and equity markets rebounded robustly from an earlier episode of turbulence in May–June 2006 as concerns about continued tightening of monetary policy in the United States eased, and remain at close to peak levels even after the recent correction (Figure 1.6). Capital flows to emerging markets were maintained at high levels in 2006 as a whole, with Asia and emerging Europe continuing to attract a large share of the flows and corporate borrowers replacing sovereigns as the main source of demand (Table 1.2).
Figure 1.4. Developments in Mature Financial Markets
Expectations of continued solid economic growth and moderating price concerns since mid-2006 have encouraged buoyant equity markets and declining long-term interest rates. Credit growth has eased somewhat but remains high.
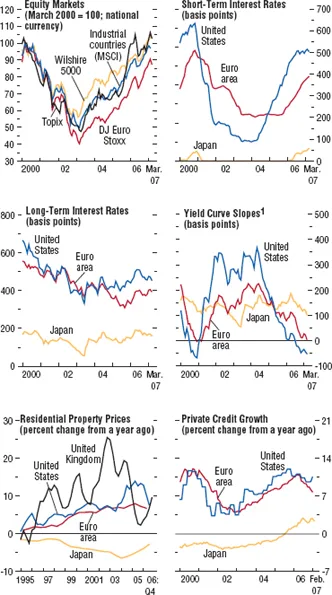
Sources: Bloomberg Financial Markets, LP; CEIC Data Company Limited; Haver Analytics; OECD; IMF, International Financial Statistics; national authorities; and IMF staff calculations.
1Ten-year government bond minus three-month treasury bill rate.
Figure 1.5. Mature Financial Market Indicators
Real interest rates are generally below long-term averages, as are price-earnings ratios in equity markets and corporate spreads. Volatility has generally remained low.
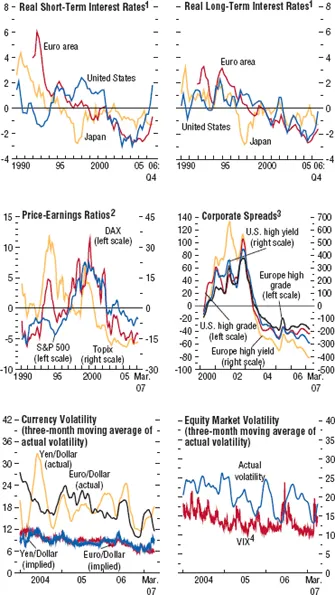
Sources: Bloomberg Financial Markets, LP; Merrill Lynch; Thomson Financial; and IMF staff calculations.
1Relative to headline inflation. Measured as deviations from 1990–2006 average.
2Twelve-month forward-looking price-earnings ratios measured as three-month moving average of deviations from 1990–2007 (March) average.
3Measured as three-month moving average of deviations from 2000–07 (March) average.
4VIX is the Chicago Board Options Exchange volatility index. This index is calculated by taking a weighted average of implied volatility for the eight S&P 500 calls and puts.
Figure 1.6. Emerging Market Financial Conditions
Emerging markets have generally remained buoyant, despite recurrent bouts of market volatility. Equity prices in many emerging markets have recorded new hi...
Table of contents
- Cover Page
- Title Page
- Copyright Page
- Content Page
- Assumptions and Conventions
- Preface
- Foreword
- Executive Summary
- Chapter 1. Global Prospects and Policy Issues
- Chapter 2. Country and Regional Perspectives
- Chapter 3. Exchange Rates and the Adjustment of External Imbalances
- Chapter 4. Decoupling the Train? Spillovers and Cycles in the Global Economy
- Chapter 5. The Globalization of Labor
- Annex: IMF Executive Board Discussion of the Outlook, March 2007
- Statistical Appendix
- World Economic Outlook and Staff Studies for the World Economic Outlook, Selected Topics
- Boxes
- Footnotes