![]() Part One
Part One
Introduction:
Consumer and Producer Behaviour![]()
Chapter 1
The Family Budget
The average London family spends almost twice as much on housing as does a family living in Wales.
This may not seem perhaps to be the most inspiring piece of information with which to begin a book on economics. Yet it is one which is full of exciting implications for an economist.
Why, one wonders, does the Londoner spend nearly £15 a week putting a roof over his head, while the Welshman spends only a little more than half that amount?1 What reasons lie behind this rather startling difference?
The explanation is unlikely to be a simple one. High housing expenditure in London certainly has something to do with the price of houses there compared to those in Wales. But that is not, in a real sense, a basic cause, for it begs the important question as to why house prices are high in the capital. Not everything is dearer in London, by any means.
It is not difficult to think of possible explanations. Does it have anything to do with costs of production? Are building costs higher in London and is the land itself more expensive? Alternatively, is it perhaps because Londoners are richer and can afford to spend more on housing? Or do Londoners just happen to enjoy being well housed relatively more than being well fed or well dressed, so that their larger housing expenditure is a reflection of their tastes? Is it perhaps even that housing needs are lower in Wales because the weather is milder and high standards of insulation are less necessary there? Or is the difference the result of government policies, such as rent control, which keep average housing costs lower in Wales than in London?
Whatever the full explanation we can be fairly sure that it is likely to involve many complex factors including some of those already mentioned as well as others. The unravelling of interrelationships of this kind, identifying the important causal links, is a part of the job of the economist, though he may often profit from drawing on the work of other social scientists, such as sociologists, psychologists, and political scientists.
Total Family Expenditure
Family expenditure on housing is only one kind ol economic behaviour that the economist tries to analyse. Attention was focused on housing because it happened to show some rather dramatic regional variations. Let us for a moment take a wider view and look at the pattern of total household expenditure in Britain.
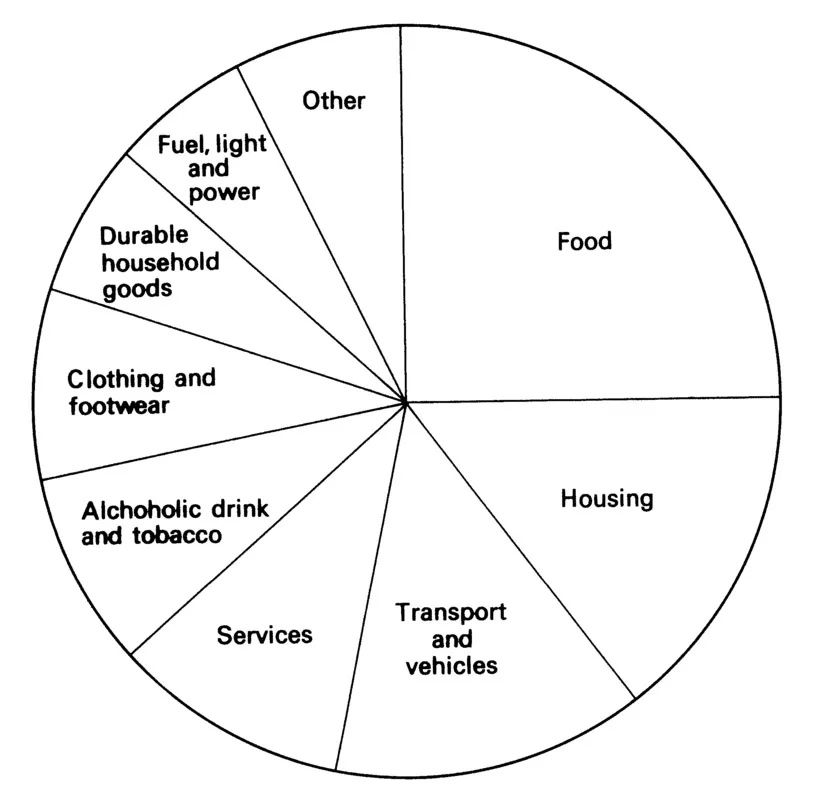
Figure 1.1 is based on information obtained from more than 10,000 families and shows how total spending was divided between various goods and services in 1977. Average weekly expenditure in that year was over £70. Income was about a third more than this, but deductions for income tax and national insurance took more than half the difference between income and expenditure while the remainder largely consisted of savings of one sort or another, including life assurance and mortgage repayments by persons buying their own houses.
Figure 1.1 Family expenditure, 1977 (average weekly expenditure of all households).
Source: Department of Employment, Family Expenditure Survey, 1977 (HMSO, 1978).
The diagram shows the way in which the population as a whole allocated its spending on goods and services. About a quarter went on food, and a trifle more on the combined categories of housing and transport. The next most important class of expenditure is described as 'services' and requires a word of explanation. This is the name given to spending which is made not to acquire tangible goods but for the performing of services. We obtain a service when, for example, someone cuts our hair, entertains us at a theatre, repairs our old alarm clock, cures us of a disease or even tries to teach us economics. The remaining categories are largely self-explanatory. Durable household goods are articles like furniture and electrical appliances. 'Other goods' comprise all products not previously covered and include such things as sports goods, newspapers, toys, medicines and toiletries.
Explaining Consumer Behaviour
The pattern of household expenditure outlined in the last paragraph throws no light on the causes of consumer behaviour, which are a concern of economists. At this stage of our study of economics we are not going to be able to identify all the reasons why people spend their income in the way that they do. We can, however, suggest what some of these reasons may be.
Two determinants are, in fact, of such great importance that they must be mentioned immediately. They are the prices of goods and services and the incomes that people have available to spend. The role of prices in determining consumption will be dealt with in Chapter 3, but we may straight away observe the influence of income.
Income and Consumption
Table 1.1 shows the way in which households with different incomes allocate their expenditure over the categories of goods and services shown in Figure 1.1. It is a simplified version of the full survey which separates sixteen income size classes. Four categories only are used here; each relates to a quarter of the total number of households from the richest to the poorest.
Study of Table 1.1 reveals a number of different kinds of relationship between income and consumption. It is useful to classify goods and services on the basis of these relationships. Two main categories may be distinguished: (1) goods where income and expenditure are inversely correlated, that is, where consumption is low at high incomes and vice versa; (2) goods and services where income and expenditure are positively correlated, that is, consumption is high at high incomes and low at low incomes.
Table 1.1 Family expenditure by household income, 1977 (per cent of total weekly expenditure on goods and services)
(1) Goods and services where income and expenditure are inversely correlated
The most common of the products where expenditure tends to decline as income rises is food. As can be seen from Table 1.1, expenditure on food accounts for nearly a third of total spending of the poorest group, but closer to a fifth of that of the highest income class. The German statistician Ernst Engel drew attention in the last century to the tendency for expenditure on food to fall proportionately as income rises, and it is sometimes known as Engel's law. Expenditure on housing and on fuel, light and power are in the same category. These are goods that are sometimes loosely described as 'necessities'. But it would be wise to resist the temptation to call them all necessities. The word has, unfortunately, no unambiguous meaning for all people. This is partly because what is absolutely essential to life forms only a very small part of the whole — the bare minimum of food and shelter to avoid death.
In current usage the term necessities includes items which are necessary not to sustain life itself, but to maintain it at a socially acceptable level. Once this view is admitted, it becomes hard to find an objective standard by which to judge whether any particular good should or should not be classed as a 'necessity'. It becomes a question of personal opinion, and it seems reasonable to expect individuals to differ in their views on the matter. A middle-class white-collar worker might consider it necessary for him to have two suits, a colour television set and perhaps even a car. On the other hand, to a student, or even a teacher, these may not even be desirable possessions. There are no universally accepted standards. Even if there were, they would certainly change over time. As societies get richer what are deemed the 'basic necessities' of life, without which a person might feel he did not approach a 'decent' standard of living, are rising almost continuously.
It is important to understand that although expenditure on a commodity may fall as a proportion of the total as income rises, this does not necessarily imply that absolutely smaller quantities of the goods are bought at higher income levels. It may or it may not be the case. But if the proportionate fall in expenditure is great enough to offset the rise in income, then consumption does indeed fall as income rises. Goods which qualify on this account happen to be given a special name in economics - inferior goods.2 By this is meant no more than that they behave in the manner described — larger quantities being bought at low incomes than at high. Inferior does not imply anything in an absolute sense, but the sort of goods which qualify are those which people find less desirable than others as they get richer.
It is likely that some goods start to become inferior after a certain income level is reached rather than throughout all ranges of income. For example, a family living close to the poverty line probably buys mainly cheap cuts of meat, margarine, potatoes and bread. As its income rises it may pass through a phase of buying more of all these things until at various points it starts to substitute butter for margarine, choicer for cheaper cuts of meat and, eventually perhaps, more meat for bread and potatoes. One example taken from the Family Expenditure Survey of a good on which expenditure at some higher incomes is absolutely less than at lower levels is coal. This is presumably, at least in part, a reflection of the fact that people who can afford more modern and expensive forms of heating, such as gas, electricity and oil, prefer it to solid fuel.
(2) Goods and services where income and expenditure are positively correlated
This is probably the most normally expected kind of relationship — that is, one where rising incomes lead to rising expenditure on a commodity. Goods and services consumption of which increases when incomes rise are, in fact, called normal in contrast to inferior. Table 1.1 suggests that clothing and footwear and transport and vehicles are in this category, as are durable household goods. Services are among the most widely recognised in this group since expenditure on them rises quite substantially with income. As people become richer they tend to spend more on holidays, dining out, entertainments, and so on.
Many things commonly and loosely described as luxuries are properly included in this class. However, for reasons similar to those which were advanced in discussing necessities, it would again be wise to resist the temptation to describe all these goods and services as luxuries, for one man's luxury is another man's necessity, to twist a cliché. It is better to stick to an objective definition of goods and services such as that based upon whether expenditure on them rises or falls as income increases.
Two exclusions
The twofold division of ways of disposing of income used so far conceals two omissions. One is major and must not be ignored. The other is minor.
- Saving. One of the most important ways of disposing of income does not appear here at all, namely, saving, that is, not spending on any goods or services. Saving does not show up in the figures presented in Table 1.1 and Figure 1.1 because these are confined to expenditure. However, there is a pronounced tendency for the proportion of income saved to be greater among the rich than among the poor, for the obvious reason that the former need to spend most, if not all, of their income to cover everyday living costs. We shall return to consider the implications of this matter in Chapter 7. A major part of economic theory is closely related to it.
- Goods on which consumption expenditure is proportional to income. The second and less important omission concerns goods expenditure on which tends to remain a fairly constant proportion of income. Table 1.1 does not throw much light by way of illustration on this category, mainly because it compresses hundreds of items into a mere nine classes. Alcoholic drink and tobacco and the miscellaneous 'other' category come closest to it (especially for the top three-quarters of households) but expenditure statistics containing more detail are needed to identify particular goods and services which qualify.
Consumption Determinants Other than Income
Attention has been concentrated so far on the relationship that exists between level of income and family expenditure. It has also been stated that the prices of goods and services influence expenditure patterns. It is clear that there are many other determinants of consumption
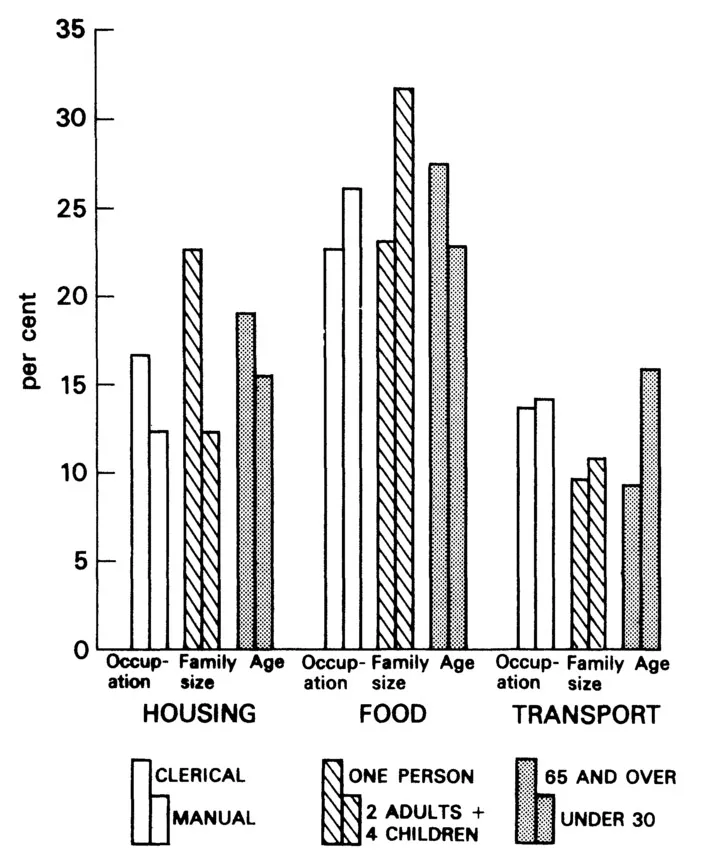
Figure 1.2 Family expenditure by occupation, family size and age, 1976 (per cent of total weekly expenditure on selected goods and services; age and occupation refer to the head of the household).
Source: as for Figure 1.1.
expenditure and Figure 1.2 has been drawn to illustrate some of them. It portrays the percentages of total weekly household expenditure that go on housing, food and transport for certain occupational, family size and age groups. The diagram shows, for example, that large families tend to spend relatively less on housing than do small ones. If this tendency seems surprising, it may be less so when it is realised that large families almost certainly need to spend relatively more on food and clothing.
Occupation also influences consumption patterns. Families whose head has a clerical job spend, on average, relatively more on housing and less on food then do those whose head is in manual work. Age is a third determinant. Households with young heads tend to spend relatively less on food and housing and more on transport than older families. The factors listed in Figure 1.2 are illustrative only and are far from complete. They do not include some determinants that have already b...