Originally published in 1960, with a second edition in 1969, this book is of special interest for having been the first systematic attempt to discuss problems of fiscal policy from the point of view of promoting economic growth in underdeveloped countries. It deals mainly with problems of tax policy, and outlines the economic principles by which the structure of taxation in developing economies can be constructed and evaluated. The work made a distinct contribution in the field of Development studies by reorienting the theory of fiscal policy originally developed in the economically advanced countries to the problems, requirements and institutional structure of an underdeveloped, over-populated country with a mixed enterprise system.
eBook - ePub
Fiscal Policy in Underdeveloped Countries
With Special Reference to India
- 220 pages
- English
- ePUB (mobile friendly)
- Available on iOS & Android
eBook - ePub
About this book
Trusted by 375,005 students
Access to over 1.5 million titles for a fair monthly price.
Study more efficiently using our study tools.
Information
Topic
EconomiaSubtopic
Business generalePOSTSCRIPT TO THE SECOND EDITION
Overall Trends in Government Finance
THE GROWTH OF THE PUBLIC SECTOR
THE scope and structure of public finance in India have changed materially from what they were at the beginning of the First Five Year Plan (1951–56). As will be seen from the figures presented in table P.I, there has been a rapid growth of the public sector as judged by different criteria. The ratio of taxation to net national product at market prices increased from 66 per cent in 1950–51 to 12·9 per cent in 1965–66, while the proportion of total government revenue increased from 8·4 to 15·3 per cent. Similarly, the ratio of government expenditure increased from 9·6 to 19·4 per cent over the same period.1 Thus government revenue nearly doubled and expenditure more than doubled as a proportion of national product within a span of fifteen years. If total public expenditure were defined to include investment expenditure by autonomous public enterprises (whose accounts are not integrated with the government budget), the increase would be even more spectacular. Alongside the considerable increase in collective consumption and public investment, there has also been a rapid rise in the share of net domestic product generated in the public sector—from 7·5 per cent in 1950–51, it is estimated to have gone up to 13·3 per cent in 1965–66.2 As national product and expenditure (at current prices) have increased by more than 120 per cent during this period, an appreciable rise in the ratio of public expenditure to national expenditure has meant a much faster increase in the former in absolute terms. Thus total expenditure by the Central and State Governments, excluding purely financial transactions, had increased from Rs 9,880 million in 1951–52 to Rs 56,665 million in 1966–67. Even if allowance is made for the rise in prices during the period, this would still give a 403 per cent increase in fifteen years, or an average rate of growth of 26·9 per cent per annum.
Vast sums of money are being raised and spent by the Governments at the Centre and the States, and over the primitive base of direct taxation which existed at the time when the Taxation Enquiry Commission (1953–54) reported, attempts have been made to build a modern and progressive system of direct taxation. Indirect taxes have proliferated and impinge on the production, sale, exchange, consumption and/or use of a very large number of commodities and assets. As a result of these developments a massive and complex structure of taxation and government expenditure has come into existence, the study and analysis of which has become a matter of prime importance.
Table P.I
SHARE OF GOVERNMENT IN NATIONAL INCOME AND EXPENDITURE AND IN GENERATION OF DOMESTIC PRODUCT
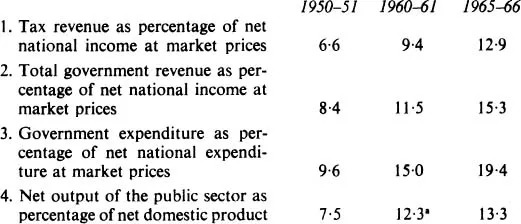
a1961–62
Sources: Central Statistical Organization:
(1) Estimates of National Income
(2) National Income Statistics—A Study of Public Sector Undertakings, New Delhi, 1963 (mimeographed)
TRENDS IN GOVERNMENT REVENUE
IN the year 1966–67, tax revenue formed 77·3 per cent of the total revenue of the Central and State Governments. Though non-tax revenue is by no means quantitatively unimportant, its share has tended to decline and the great bulk of the income of the government sector is drawn from taxes. The trends in the composition of tax revenue are presented in table P.II. It will be seen that in spite of the growing modernization of the economy and the introduction of new direct taxes, the proportion of indirect taxes in the total tax revenue has appreciably increased during the period under review. As high as 76·5 per cent of tax revenue is being raised through taxes on commodities and transactions. The main reason for the rise in this ratio since 1951–52 is that a very large part of the increase in revenue was brought about through the exploitation of several indirect taxes which were relatively unimportant earlier and through continued rate increases in respect of the major commodity taxes already in existence.
Table P.II
COMPOSITION OF TAX REVENUE OF THE CENTRE AND THE STATES
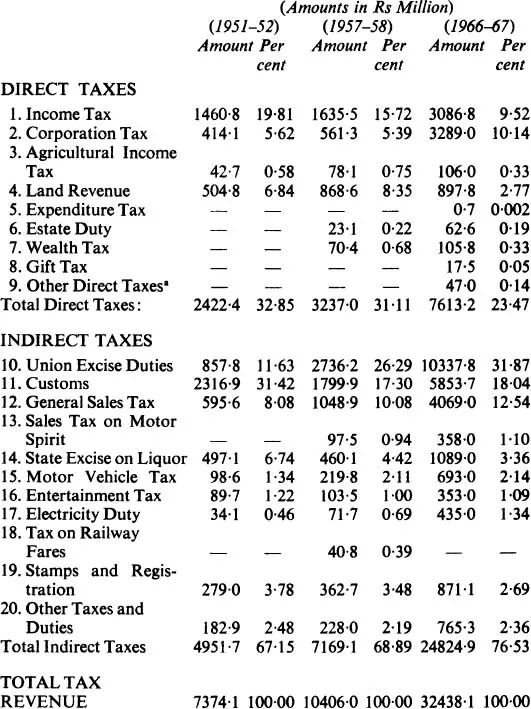
a Profession tax and urban immovable property tax.
Source : Reserve Bank of India Bulletins; adjusted figures.
Union excise has emerged as the largest single source of tax revenue bringing in considerably more revenue than all the direct taxes put together and nearly 42 per cent of the yield of indirect taxes. Its relative share in total tax revenue has almost trebled. The relative shares of most of the indirect taxes have risen, the two important exceptions being those of customs and States excise on liquor. The former has lost ground owing to the virtual stoppage of the imports of consumer goods, while the yield from the latter has been affected by the policy of prohibition followed by most of the State Governments until recently. Customs, however, constitute the second largest source of revenue, the third being the sales taxes levied by the State Governments. It may be also noted that Union excise, State excise and sales taxes together bring in as much as 64 per cent of total tax revenue.
While it cannot be said that direct taxes are unimportant in the Indian tax system, the bulk of the additional tax revenue, as already indicated, has been raised through indirect taxes. The newer direct taxes like the annual wealth tax are as yet insignificant from the revenue point of view and at the same time the relative share of taxes on income1 has fallen from one-fourth to about one-fifth of total tax revenue. Surprisingly, the corporate income tax has become slightly more important than the tax on personal income2 and accounts for about 43 per cent of revenue from direct taxes. Its yield, since it was converted into a non-refundable tax in 1959–60, has recorded a fairly high rate of growth, partly due to rate increases and partly due to its inherent income-elasticity.
Among the sources of non-tax revenue, income from property and enterprise are potentially important as it is the accepted policy to extend the scope of the public sector in terms of ownership as well as entrepreneurship. According to national income figures, this source has accounted for about 12 per cent of the income of the government sector in recent years. But a considerable proportion of this (48 per cent) is represented by interest receipts, against which have to be counted interest payments by the government. If interest receipts are treated as constituting reduction of expenditure, the share of property and enterprise income would come down to around 7 per cent of total government revenue. And as many of the public sector enterprises are being run as autonomous corporations or companies, only a portion of their profit would accrue to the government budget. Hence, as far as general government is concerned, taxation would continue to be by far the major provider of revenue for many years to come.
TRENDS IN GOVERNMENT EXPENDITURE
INDIAN budgets have traditionally been divided into revenue and capital accounts. Though this division does not exactly correspond to the economic classification into current expenditure and investment, adjusted budgetary figures have to be used to get a rough idea of the trends in the composition of expenditure, as the economic classification provided by the Estimates of National Income gives no functional breakdown.
Expenditure on revenue account currently forms about 70 per cent of total expenditure.1 The share of capital expenditure is shown to be fairly low because much of public sector investment is undertaken by non-departmental public enterprises. It is also true that some items of expenditure of a capital nature are included in the revenue account. However, it seems clear that as far as general government is concerned, the major part of expenditure is accounted for by what one might classify as current expenditure in the economic sense of the term.
Government expenditure may also be broadly divided into development and non-development expenditure, the former being broadly defined to include all expenditure leading directly to the promotion of economic development or social welfare, and the latter comprising the rest of the expenditure.
The share of development expenditure increased over the period under review, mainly due to the more rapid rise in capital expenditure which consisted predominantly of expenditure on developmental items. Slightly more than 48 per cent of total expenditure now (1966–67) consists of development expenditure, while nearly 78 per cent of capital expenditure is incurred on developmental items. On the other hand, the major part of expenditure on revenue account consists of non-development expenditure.2
The trends in the composition of expenditure on revenue account may be briefly noted. The share of non-development expenditure on revenue account, which had fallen between 1951–52 and 1957–58, rose after that period and has now reached 64 per cent of the total. It is found that the main reason for this increase is the fact that “debt services”1 is included in non-development expenditure. It is significant that the percentage shares of cost of collection of taxes, civil administration and even defence have fallen over the period. But the share of debt services has risen from 6·4 per cent to 20·3 percent.2 As most of the increase in public debt in India during this period has been on account of public sector capital formation, the rise in the level of public debt interest is only a reflection of the stepping up of development expenditure under the successive plans. If interest on public debt were to be included in development expenditure, or to be kept apart as “unallocable”, development expenditure would be shown to have risen faster than non-development expenditure on revenue account.
Much has been said about the wasteful increase in public expenditure in recent years. It must be conceded that the greater part of the increase in total government expenditure has been due to the stepping up of the so-called development expenditure and to rising interest payments. While economy in administrative and defence expenditure is extremely important, a major problem in Indian public finance today is to secure the proper allocation of, and ensure economy in, development expenditure. This problem has so far hardly received the attention it deserves.
As the rapid increase in public expenditure has taken place in the context of a federal constitution, it has brought to the fore, in an acute manner, what may be called the traditional problem of federal finance in the form of a large and widening gap between the own resources and expenditure of the State Governments. Table P.III shows the distribution of expenditure between the Central and State Governments. The States account for less than half of total expenditure, but what is more important perhaps is the fact that they account for 55 per cent of the expenditure on revenue account. The adequacy of taxing powers has to be judged more directly in relation to the growing needs on revenue account. On capital account, the Central Government accounts for the major portion of outlay, its share having steadily increased during the period.1
Table P.III
EXPENDITURE OF CENTRAL AND STATE GOVERNMENTS*
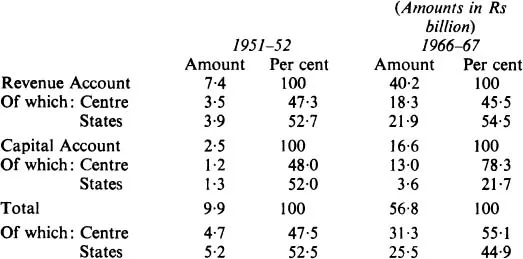
* Excluding purely financial transactions
Source: Reserve Bank of India Bulletins, adjusted figures.
The larger and increasing capital outlay at the Centre is mainly due to investment in large-scale industries and railways as well as defence outlay being in the Central sphere. Besides, the extent of capital outlay by the States is very much dependent on the quantum of Central lending.
As against the distribution of expenditure on revenue account as shown above, the share in revenue resources happens to be markedly in favour of the Central Government. It is seen from table P.IV that the taxes levied by the State Governments account for slightly less than 30 per cent of total tax revenue and that the addition of the Central taxes transferred under the tax-sharing scheme raises the States’ share only to around 40 per cent. The corresponding figures in 1951–52 were 30 and 38 per cent, respectively. As regards non-tax revenue, the share of the States has fallen from 65 to 44 per cent. All in all, the States command, even after the devolution of Central taxes, only around 40 per cent of the revenue resources, whereas they account for about 55 per cent of the expenditure on revenue account. The large gap indicated by this substantial divergence is being met partly through grants under the awards of the Finance Commission (appointed every five years) and partly through Plan grants made under Article 282 of the Constitution primarily on the recommendations of the Planning Commission. On capital account, the position is that no appreciable Plan investment by the States would at all be possible but for continuing large-scale loans from the Centre, which account for 75 per cent of the gross capital receipts of the States. With these developments, the problem of co-ordination of tax policies, the impact of federal assistance on the distribution of resources as well as on the behaviour of the governments of the units, the implications of a large-scale programme of federal loans to the States, question of the management of the public debt of the individual States—all of these have moved to the forefront of issues demanding immediate and careful analysis.
Table P.IV
TAX AND NON-TAX REVENUES OF CENTRAL AND STATE GOVERNMENTS
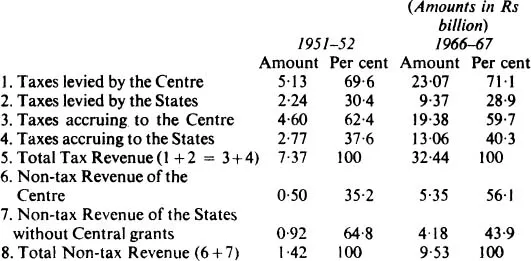
Source: As for Table P.III
Public Sector Savings and Investment
It has been part of the accepted philosophy of Indian planning that taxation should be used to raise the marginal rate of savings in the economy. More ambitiously, it had been argued in the early fifties that an increasing proportion of public investment should be financed out of taxation.1
However, the greater part of the increases in revenue were actually absorbed by increases in current expenditure, though the rate of Government saving did register a modest rise. An analysis of the data presented by the Central Statistical Organization shows that the average ratio of government saving to government revenue was around 12 per cent in the 5-year period 1955–60 and around 17 per cent in the period 1960–65. According to simple calculations based on differences between end-years, the marginal rates of saving in the two periods work out to 13·8 and 18·8 per cent, respectively.2 Thus, while the government did succeed in raising the rate of budgetary saving during the first half of the sixties, additional saving amounted to less than 20 per cent of the additional revenue. In the years since 1964–65, the rate of government saving seems to have fallen rather steeply.
Total savings o...
Table of contents
- Cover
- Halftitle
- Title
- Copyright
- Dedication
- Preface
- Contents
- I. Introduction
- II. Role of Fiscal Policy in Underdeveloped Economies
- III. Structure of Taxation Most Appropriate for India
- IV. An Examination of Some of the Basic Features of the Indian Fiscal System
- Postscript to the Second Edition: Overall Trends in Government Finance
- Index
Frequently asked questions
Yes, you can cancel anytime from the Subscription tab in your account settings on the Perlego website. Your subscription will stay active until the end of your current billing period. Learn how to cancel your subscription
No, books cannot be downloaded as external files, such as PDFs, for use outside of Perlego. However, you can download books within the Perlego app for offline reading on mobile or tablet. Learn how to download books offline
Perlego offers two plans: Essential and Complete
- Essential is ideal for learners and professionals who enjoy exploring a wide range of subjects. Access the Essential Library with 800,000+ trusted titles and best-sellers across business, personal growth, and the humanities. Includes unlimited reading time and Standard Read Aloud voice.
- Complete: Perfect for advanced learners and researchers needing full, unrestricted access. Unlock 1.5M+ books across hundreds of subjects, including academic and specialized titles. The Complete Plan also includes advanced features like Premium Read Aloud and Research Assistant.
We are an online textbook subscription service, where you can get access to an entire online library for less than the price of a single book per month. With over 1.5 million books across 990+ topics, we’ve got you covered! Learn about our mission
Look out for the read-aloud symbol on your next book to see if you can listen to it. The read-aloud tool reads text aloud for you, highlighting the text as it is being read. You can pause it, speed it up and slow it down. Learn more about Read Aloud
Yes! You can use the Perlego app on both iOS and Android devices to read anytime, anywhere — even offline. Perfect for commutes or when you’re on the go.
Please note we cannot support devices running on iOS 13 and Android 7 or earlier. Learn more about using the app
Please note we cannot support devices running on iOS 13 and Android 7 or earlier. Learn more about using the app
Yes, you can access Fiscal Policy in Underdeveloped Countries by Raja J. Chelliah in PDF and/or ePUB format, as well as other popular books in Economia & Business generale. We have over 1.5 million books available in our catalogue for you to explore.