Chapter 1
Boom, bust and beyond
Peter Warr
In the second half of 1997 and throughout 1998, Thailand experienced a deep economic contraction, interrupting 40 years of continuous growth. This contraction, now commonly known as ‘the crisis’, was in fact the consequence of two crises in one: first, there was a currency crisis, which then produced a banking crisis. These twin crises changed public affairs in Thailand permanently. Six years later, it is appropriate to review their significance. What caused ‘the crisis’? How bad was it? How has it changed the priorities of economic and social policy? Has Thailand recovered fully from its effects? Are there any positive outcomes from the crisis? Is the country presently on a sustainable path of economic development? These matters are the focus of this book. The present chapter concentrates on the macroeconomic issues.
We begin with a sketch of the past half-century of Thai economic history.1 Viewed from this long perspective, Thailand must surely be considered a great economic success story. At the end of World War II it was one of the world’s poorest countries. Its economy had been stagnant for at least a century (Sompop 1989), it was seriously affected by the war itself, and most observers of the time rated its economic prospects very poorly (Ingram 1971). They were mistaken. By the mid-1990s Thailand was widely considered a champion of sustained development, having achieved a combination of rapid growth, macroeconomic stability and steadily declining poverty incidence, extending over several decades. Over the period 1965 to 1996, the average annual growth rate of Thailand’s real GNP per person was well over 5 per cent (over 7 per cent per annum in total), compared with an average of 2.4 per cent for low- and middle-income countries (World Bank 1998).
Then came the boom. During the decade 1987 to 1996, the Thai economy was the fastest growing in the world. As we shall see below, this boom was driven by very high levels of investment, both domestic and foreign. Even more remarkable than the rate of growth over this long period was the stability of the growth. Not a single year of negative growth of real output per head of population was experienced over the four decades from 1958 to 1996, a unique achievement among oil-importing developing countries. Thailand’s performance was often described as an example others might emulate. Its principal economic institutions, including its central bank, the Bank of Thailand, were cited as examples of competent and stable management.
The twin crises of 1997–98 changed all that. Domestically, the economy was in disarray: output and investment were contracting; poverty incidence was rising; the exchange rate had collapsed, following the decision to float the currency in July 1997; the government had been compelled to accept a humiliating IMF bailout package; the financial system was largely bankrupt; and confidence in the country’s economic institutions, including the Bank of Thailand, was shattered. Internationally, Thailand was now characterized as the initiator of a ‘contagion effect’ in Asian financial markets, undermining economic and political stability and bringing economic hardship to millions of people.
Since the crisis, Thailand’s economic recovery has been disappointing. Real GDP growth has been moderate, and it was not until 2003 that the level of real GDP per capita had recovered to its level of 1996; foreign direct investment had declined dramatically since 1998; and private domestic investment remained sluggish.
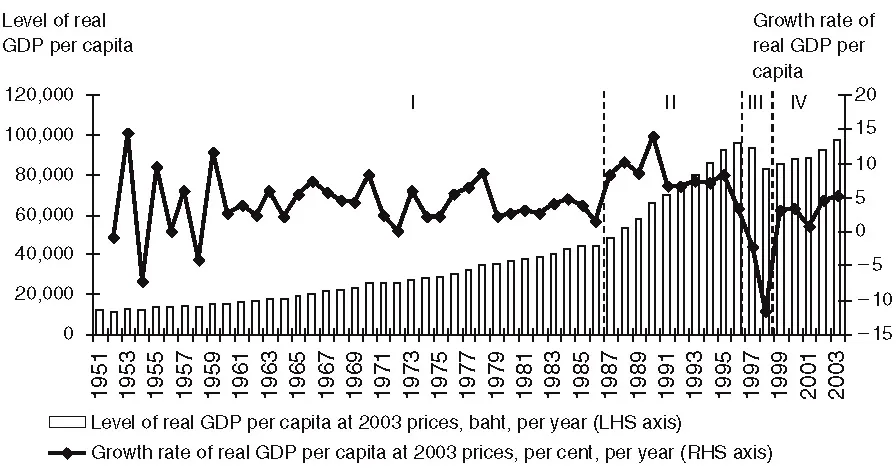
Figure 1.1 summarizes the above events, showing real GDP per capita and its growth rate from 1951 to 2003. In 2003, the level of real economic output per person was more than eight times its level 50 years earlier. The average annual rate of growth of real GDP per person over this entire period was 4.3 per cent. The figure divides this period into four phases.
Figure 1.1 Thailand: real GDP per capita and growth of real GDP per capita, 2003 prices, 1951 to 2003 (source: author’s calculations using data from National Economic and Social Development Board, Bangkok).
Table 1.1 Thailand: rates of growth of GDP and GDP per capita, 1951 to 2003
Their average annual rates of growth of real GDP and real GDP per person are summarized in Table 1.1. A fuller summary of Thailand’s macroeconomic performance from 1985 to 2003 is provided in Table 1.2.
The crisis of 1997–98 eroded the economic gains that had been achieved in previous decades, but by no means erased them. In 1998, the level of real GDP per person was 14 per cent below its level in 1996, but this was still seven times its level in 1951. Positive growth was achieved in all subsequent years to 2003 (phase IV), but at an average rate of only 3.3 per cent (1999 to 2003).
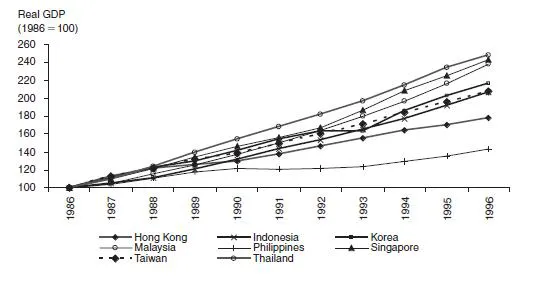
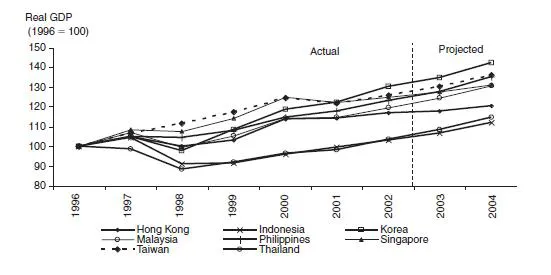
Figure 1.2 places the last two decades in a comparative East Asian perspective. Data on real GDP are presented for eight East Asian economies, including Thailand. The pre-crisis period of 1986 to 1996 is covered in panel (a), with each country’s 1986 level of real GDP indexed to 100. The crisis and post-crisis periods of 1996 to 2004 (data for 2003 and 2004 are projections from the Pacific Economic Cooperation Council) are shown in panel (b), with 1996 real GDP indexed to 100. Panel (a) shows that Thailand’s boom was the largest of the countries shown, but only marginally so. Singapore, Malaysia, Indonesia, Korea and Taiwan were not far behind. Panel (b) shows that, in 1998, serious contractions occurred in Korea, Malaysia and Indonesia, but that, relative to 1996, Thailand’s initial contraction was the most severe. Along with Indonesia, its contraction has also been the most long lasting. Thailand’s crisis was initially more severe than Indonesia’s, but Indonesia did not experience a comparable recovery in 1999. It is commonly said that Indonesia’s economic crisis was more severe than Thailand’s, but these data show that, as of 2002, the magnitude of their contractions of real GDP relative to their 1996 levels were almost identical.
This chapter is about the forces driving Thailand’s experience, as summarized above. The structure of the chapter is as follows. We begin with an analysis of the long-term factors that produced the boom decade following 1987, but which also left Thailand vulnerable to both a currency crisis and a banking crisis. This is contained in the following section (Boom). The next section (Bust) identifies the short-term trigger that led to the expectation of a devaluation, which then precipitated the currency crisis, and which in turn produced the banking crisis.2 The final section (Beyond) reviews the prospects for the Thai economy following the crisis.
Table 1.2 Thailand: macroeconomic summary, 1985 to 2003 (per cent annual growth rate, unless otherwise specified)
Figure 1.2a Real GDP in East Asia, 1986 to 1996 (source: ADB, Key Indicators, various issues).
Figure 1.2b Real GDP in East Asia, 1996 to 2004 (source: ADB, Key Indicators, various issues; 2003 and 2004 projections from Pacific Economic Cooperation Council, Pacific Economic Outlook 2003–04).
Boom
Thailand’s crisis ended a long economic boom, unprecedented in its rate and duration – not only in Thailand, but almost any country. It is not possible to understand the crisis of 1997 except in the context of the boom that preceded it, because the crisis was the collapse of that boom. Over the pre-crisis period of 1988 to 1996, real GDP had grown at close to 10 per cent per annum. What fuelled this extraordinary growth?
Explaining the boom
Explaining long-term growth involves distinguishing between the growth of the factors of production employed and the growth in their productivity. We now discuss a growth accounting exercise for Thailand, covering the years 1981 to 2002, divided into the four periods indicated in Figure 1.1, and for the entire 1981 to 2002 period. The periods of greatest interest are the pre-boom years of 1981 to 1986 and the boom period of 1987 to 1996. The assumption being made is that during these periods, output was primarily supply-constrained; aggregate demand was not the binding constraint on output. As we shall see below, the crisis and recovery periods from 1997 onwards were characterized by a deficiency of aggregate demand. A growth accounting framework, which focuses on the determinants of aggregate supply, is therefore of limited relevance for such periods. The data are included here mainly for completeness.
Table 1.3 shows the growth rates of factors of production employed over the four periods indicated in Figure 1.1, beginning in 1981, and for the entire 1981 to 2002 period. The data are presented for the economy in aggregate and for the separate sectors – agriculture, industry (along with its manufacturing component), and services.3 The data on labour inputs are adjusted for changes in the quality of the workforce by disag-gregating the workforce by the educational characteristics of workers and weighting these components of the workforce using time series wage data for the educational categories concerned. Data on land inputs are similarly adjusted for the changing quality of land inputs by disaggregating by irrigated and non-irrigated land and aggregating these components using data on land prices.
Table 1.3 Thailand: growth of factors of production, 1981 to 2002
In Table 1.4, these data are combined with information on GDP and its sectoral components, along with time series data on factor cost shares over time compiled from factor price data. These factor cost shares impose the assumption of constant returns to scale. The data on factor contributions shown in the table weight the growth rates of factors by their cost shares, producing an estimate of the degree to which growth of output is attributable to growth of the factor concerned. These data are then used to calculate total factor productivity growth as a residual. We will return to this table throughout this chapter. For now, we concentrate on the pre-boom and boom periods of 1981 to 1986 and 1987 to 1996, respectively.
The point that stands out most clearly from Tables 1.3 and 1.4 is the rapid growth of the physical capital stock in both periods, but especially during the boom. The capital stock grew more rapidly than output in both the pre-boom and boom periods. Table 1.4 indicates that this growth of the capital stock accounted for more than half of the growth of output in both periods. TFP growth was moderately important during both periods, but especially during the boom, accounting for 16 per cent and 21 per cent of output growth in these two periods, respectively. It is notable that the rate of TFP growth was highest in agriculture, where it accounted for most of the output growth. TFP growth in industry and services was much more modest.
Table 1.4 Thailand: growth accounting, 1981 to 2002
Improvements in the quality of the labour force made only a modest contribution to Thailand’s boom because the performance of its educational sector had been among the weakest in East Asia. Secondary school participation rates were low and did not improve greatly during the pre-boom and boom periods (see Sirilaksana 1993, and Chapter 9 of this volume). Similarly, since the 1960s, the expansion of the cultivated land area was small, so growth of the stock of land was not the source either. It is therefore not surprising that the explanation for Thailand’s boom lies with the capital stock. Both foreign direct investment and domestic investment grew, but growth of foreign direct investment (FDI) was proportionately larger, from about 1987 (Warr 1993). This period of rapid growth of FDI coincides with the period of most rapid total factor productivity growth.
From annual rates of inflow varying between US$100 and US$400 million over the previous 15 years, the annual rate of FDI inflow rose more than fivefold in 1987, to over US$2 billion per year, and remained at roughly these levels over the next 8 years. Rates of domestic saving and investment were also high, but the stock of capital represented by foreign direct investment was increasing more rapidly than the stock represented by domestic investment. The proportion of the total capital stock that was represented by foreign direct investment was thus increasing.
To explain the boom we must take note of the massive inflow of foreign capital and abandon the notion that foreign and domestic capital are perfect substitutes. However, this inflow of foreign capital, along with the domestic investment boom that accompanied it, did not merely fuel the boom. Its magnitude and its changing composition, combined with the policy environment of the time, also created the foundations for the collapse of 1997.
Before turning to a more detailed examination of the sources of the growth of the aggregate capital stock it is helpful to review a further feature of the analysis underlying Tables 1.3 and 1.4. The data presented make it possible to distinguish between two components of aggregate total factor productivity (TFP) growth: the growth of productivity in individual sectors and the produ...