- 323 pages
- English
- ePUB (mobile friendly)
- Available on iOS & Android
eBook - ePub
About this book
Written by experts, Digital Terrain Modeling: Principles and Methodology provides comprehensive coverage of recent developments in the field. The topics include terrain analysis, sampling strategy, acquisition methodology, surface modeling principles, triangulation algorithms, interpolation techniques, on-line and off-line quality control in data a
Tools to learn more effectively

Saving Books

Keyword Search

Annotating Text

Listen to it instead
Information
CHAPTER 1
Introduction
1.1 REPRESENTATION OF DIGITAL TERRAIN SURFACES
People live on Earth and learn to cope with its terrain. Civil engineers design and construct buildings on it; geologists try to study its underlying construction; geomorphologists are interested in its shape and the processes by which the landscape was formed; and topographic scientists are concerned with measuring and describing its surface and presenting it in different ways, for example, using maps, orthoimages, perspective views, etc. Despite these differences in emphasis and interest, these specialists have a common interest, that is, they wish the surface of the terrain to be represented conveniently and with a certain accuracy.
1.1.1 Representation of Terrain Surfaces
People have tried every means to represent phenomena on the terrain that they have been familiar with since ancient times, and painting may be the oldest representation. A painting offers some general information (e.g., shape and color) about the terrain which it depicts; however, the metric quality (or accuracy) is extremely low and, thus, it cannot be used for engineering purposes.
Another ancient but effective terrain representation is maps, which are still widely used today. Maps have played as important a role in the development of society as language. Indeed, maps have been used to represent the environments during the history of civilization.
In ancient times, semi-symbolic and semi-pictorial descriptions were used to depict the actual three-dimensional (3-D) terrain surface. Again, the metric quality (or accuracy) was very low. Modern maps employ a well-designed symbol system and a well-established mathematical basis for representation so that they possess three major characteristics:
- measurability warranted by the mathematical rules
- overview provided by generalization
- intuition by symbolization.
A contoured topographic map is perhaps the most familiar way of representing terrain. On a topographic map, all features present on the terrain are projected orthogonally onto a 2-D horizontal datum. Detail is then reduced in scale and represented by lines and symbols. Terrain height and morphological information are represented by contour lines. The use of such maps can be traced back to the 18th century. It is believed by many that the contour map is one of the most important inventions in the history of mapping due to its convenience and intuition to perceive. Figure 1.1 is an example of the contour map.
Essentially, a map is a scientific generalization and abstraction of features on the terrain. Typically, and perhaps most importantly, topographic maps make use of 2-D representation for 3-D reality. There is always a gulf between the 2-D representation and the 3-D reality. Because of this gulf, cartographers have been devoting themselves to the 3-D representation of terrain topography for years. Scenography, hachuring, shading and hypermetric tints (color layers) have been traditionally used on topographic maps; however, only shading is still widely in use because it can be easily generated by computers. Figure 1.2 is an example of a topographic map with shading.
Compared to various line drawings, images have some advantages: for instance, they are more detailed and easier to understand. Therefore, as soon as photography was invented, it was used extensively to record the colorful world we live in. Since 1849, photographs, and later aerial photographs, have been used for terrain representation. However, in an aerial photograph, one dimension of the 3-D surface, the height, is essentially absent, so that a single aerial photograph cannot be used to derive information about the true heights of ground points. The rectified aerial images can be used as a plan in some sense. However, 3-D surfaces can be reconstructed by using a pair of aerial photographs with a certain percentage of overlap (i.e., 60% normally). This technique is called photogrammetry.
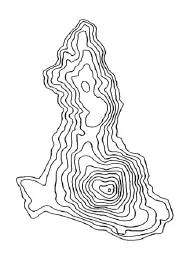
Figure 1.1 Contour map of a small island.
Satellite images have been used to complement aerial photography since the 1970s. Many satellite systems take overlapping images of the terrain so that these images can also be used to construct 3-D models. SPOT and, more recently, IKONOS are two examples. Figure 1.3 is an example of IKONOS satellite images. However, the resolution of satellite images is still not compatible with aerial images.
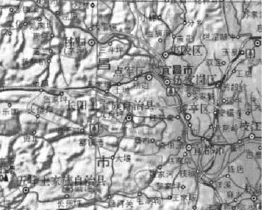
Figure 1.2 A topographic map with shading.
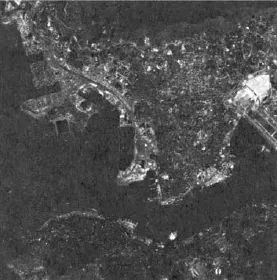
Figure 1.3 An IKONOS image of Hong Kong with 4 m resolution. The color plate can be viewed at http://www.crcpress.com/e_products/downloads/download.asp?cat_no=TF1732 .
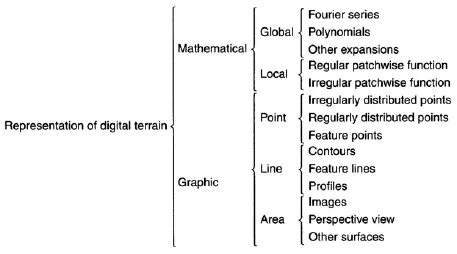
Figure 1.4 A classification scheme of representation of digital terrain surfaces.
Terrain can also be represented by a perspective view. The process of representing a surface in this way includes projecting it onto a plane and removing those lines that are not visible from the point of projection. One such product is the so-called block diagram and another is the perspective contour diagram. For easy production, a digital model of the terrain surface is essential.
1.1.2 Representation of Digital Terrain Surfaces
Since the middle of the 20th century, various digital terrain representation techniques have been developed with the development of computing technology, modern mathematics, and computer graphics. Nowadays, the use of the computer has become a significant landmark in the information era. Indeed, computers have become an important means for the representation of digital terrain surface.
Digital terrain surfaces can be represented mathematically and graphically. Fourier series and polynomials are common mathematic representations. Regular grid, irregular grid, contouring and the sectional diagram are common graphic representations. Figure 1.4 illustrates these.
1.2 DIGITAL TERRAIN MODELS
In representing the terrain surface, the digital terrain model (DTM) is one of the most important concepts. This section will discuss this concept, starting from the general model.
1.2.1 The Concept of Model and Mathematical Models
A “Model is an object or a concept which is used to represent something else. It is reality scaled down and converted to a form which we can comprehend” (Meyer 1985). A model may have a few specific purposes such as prediction and control, etc., in which case, the model only needs to have just enough significant detail to satisfy these purposes. The model may be used to represent the original situation (system or phenomenon) or it may be used to represent some proposed or predicted situation.
Thus, the word model usually means a representation and in many situations it is used to describe the system at hand. Consequently, there are strong differences of opinion as to the appropriate use of the word model. For example, it may be applied to a photogrammetric replication of a piece of the terrain surface which has been photographed or it may suggest a perspective view of the piece of terrain.
Generally speaking, there are three types of models:
- conceptual
- physical
- mathematical.
The conceptual model is the model borne in a person’s mind about a situation or an object based on his knowledge or experience. Often this particular type of model forms the primary stage of modeling and will be followed later by a physical or mathematical model. However, if the situation or object is too difficult to represent in any other way, then the model will remain conceptual.
A physical model is usually an analog model. An example of this kind of model would be a terrain model made of rubber, plastic, or clay. A stereo model of terrain based on optical or mechanical projection principles, which is widely used in photogrammetry, would also fall into this category. A physical model is usually smaller than the real object in geosciences.
A mathematical model represents a situation, object, or phenomenon in mathematical terms. In other words, a mathematical model is a model whose components are mathematical concepts, such as constants, variables, functions, equations, inequalities, etc.
Mathematical models may be divided into two types (Saaty and Alexander 1981):
- quantitative models, based on a number system
- qualitative models, based on set theory, etc., and not reducible to numbers.
Also, a problem may be either deterministic or subject to changes and therefore probabilistic. Therefore, mathematical models may also be classified into
- functional models, which are those intended to solve deterministic problems
- stochastic models, which are those used to solve probabilistic problems.
One very important question about mathematical models is “what kind of benefit can one have by using mathematical models” or “why should we make use of mathematical models?” Saaty and Alexander (1981) give the following reasons:
- Models permit abstraction based on logical formation using a convenient language expressed in a shorthand notation, thus enabling one to better visualize the main elements of a problem while at the same time satisfying communication, decreasing ambiguity, and improving the chance of agreement on the results.
- They allow one to keep track of a line of thought, focusing attention on the important parts of the problem.
- They help one to generalize or apply the results of solving problems on the other areas.
- They provide an opportunity to consider all the possibilities, to evaluate alternatives, and to eliminate the impossible ones.
- They are tools for understanding the real world and discovering natural laws.
Next, comes the question “what kind of mathematical models should be used?” This is related to the problem of how to judge the goodness or value of a mathematical model. Meyer (1985) provides six criteria for the evaluation of mathematical models:
- accuracy: the output of the model is correct or very nearly correct
- descriptive realism: based on correct assumptions
- precision: the prediction of the model is definite numbers, functions, or geometric figures
- robustness: relative immunity to errors in the input data
- generality: applicability to a wide variety of situations
- fruitfulness: the conclusions are useful, or inspiring and pointing the way to other good models.
To this list, Li (1990) has added one more criterion, namely, simplicity: the smallest possible number of parameters are used in the model. This is based on the fact that complicated models are not always needed even though a phenomenon may be complicated and is also in accordance with the principle of parsimony (Cryer 1986).
1.2.2 The Terrain Model and the Digital Terrain Model
Terrain models have always appealed to military personnel, planners, landscape architects, civil engineers, as well as other experts in various earth sciences. Originally, terrain models were physical models, made of rubber, plastic, clay, sand, etc. For example, during the Second World War, many models were made by the American Navy and reproduced in rubber (Baffisfore 1957). In the recent Folklands War in 1982, the British forces in the field used sand and clay models extensively to plan military operations.
The introduction of mathematical, numerical, and digital techniques to terrain modeling owes much to the activities of photogrammetrists working in the field of civil engineering. In the 1950s, photogrammetry had begun to be used widely to collect data for highway design. Roberts (1957) first proposed the use of the digital computer with photogrammetry as a new tool for acquiring data for planning and design in highway engineering. Miller and Laflamme (1958) of Massachussetts Institute of Technology (MIT) described the development in detail. They selected and measured from stereo models the 3-D coordinates of the terrain points along designed roads and formed digital profiles in the computer to assist road design. They also introduced the concept of the digital terrain model. The definition given by them is as follows:
The digital terrain model (DTM) is simply a statistical representation of the continuous surface of the ground by a large number of selected points with known X, Y, Z coordinates in an arbitrary coordinate field.
Compared to traditional analog representation, a DTM has the following specific features:
- A variety of representation forms: In digital form, various forms of representations can be easily produced, such as topographic maps, vertical and cross sections, and 3-D animation.
- No accuracy loss of data over time: As time goes by, paper maps may be deformed, but the DTM can keep its precision owing to the use of digital medium.
- Greater feasibility of automation and real-time processing: In digital form, data integration and updating are more flexible than in analog form.
- Easier multi-scale representation: DTM can be arranged in different resolutions, corresponding to representations at different scales.
1.2.3 Digital Elevation Models and Digital Terrain Models
In a sense, the DTM was...
Table of contents
- Cover Page
- Title Page
- Copyright Page
- Preface
- Chapter 1 Introduction
- Chapter 2 Terrain Descriptors and Sampling Strategies
- Chapter 3 Techniques for Acquisition of DTM Source Data
- Chapter 4 Digital Terrain Surface Modeling
- Chapter 5 Generation of Triangular Irregular Networks
- Chapter 6 Interpolation Techniques for Terrain Modeling Surface
- Chapter 7 Quality Control in Terrain Data Acquisition
- Chapter 8 Accuracy of Digital Terrain Models
- Chapter 9 Multi-Scale Representations of DigitalModels Terrain
- Chapter 10 Management of DTM Data
- Chapter 11 Contouring from Digital Terrain Models
- Chapter 12 Visualization of Digital Terrain Models
- Chapter 13 Interpretation of Digital Terrain Models
- Chapter 14 Applications of Digital Terrain Models
- Chapter 15 Beyond Digital Terrain Modeling
- Epilogue
- References
Frequently asked questions
Yes, you can cancel anytime from the Subscription tab in your account settings on the Perlego website. Your subscription will stay active until the end of your current billing period. Learn how to cancel your subscription
No, books cannot be downloaded as external files, such as PDFs, for use outside of Perlego. However, you can download books within the Perlego app for offline reading on mobile or tablet. Learn how to download books offline
Perlego offers two plans: Essential and Complete
- Essential is ideal for learners and professionals who enjoy exploring a wide range of subjects. Access the Essential Library with 800,000+ trusted titles and best-sellers across business, personal growth, and the humanities. Includes unlimited reading time and Standard Read Aloud voice.
- Complete: Perfect for advanced learners and researchers needing full, unrestricted access. Unlock 1.4M+ books across hundreds of subjects, including academic and specialized titles. The Complete Plan also includes advanced features like Premium Read Aloud and Research Assistant.
We are an online textbook subscription service, where you can get access to an entire online library for less than the price of a single book per month. With over 1 million books across 990+ topics, we’ve got you covered! Learn about our mission
Look out for the read-aloud symbol on your next book to see if you can listen to it. The read-aloud tool reads text aloud for you, highlighting the text as it is being read. You can pause it, speed it up and slow it down. Learn more about Read Aloud
Yes! You can use the Perlego app on both iOS and Android devices to read anytime, anywhere — even offline. Perfect for commutes or when you’re on the go.
Please note we cannot support devices running on iOS 13 and Android 7 or earlier. Learn more about using the app
Please note we cannot support devices running on iOS 13 and Android 7 or earlier. Learn more about using the app
Yes, you can access Digital Terrain Modeling by Zhilin Li,Christopher Zhu,Chris Gold in PDF and/or ePUB format, as well as other popular books in Technology & Engineering & Civil Engineering. We have over one million books available in our catalogue for you to explore.