2
Global warming
Keith Boucher
FIELD OF STUDY AND RELEVANT LITERATURE
Global warming is a term that entered the domain of both popular and scientific literature during the 1980s. It is closely linked with the idea of an increasing greenhouse effect, which was first calculated by a Swedish chemist, Svente August Arrhenius, in 1896 (Arrhenius 1997). It is believed that our atmosphere acts rather like a greenhouse, in which the glass allows solar radiation to pass through, where it is converted into heat. This heat is absorbed by the soil before being radiated out as long-wave radiation and intercepted this time by the glass, which re-radiates some of the energy back into the greenhouse. The atmosphere has properties rather similar to the glass of the greenhouse, hence the ‘greenhouse effect’, originally postulated by the French mathematician Jean-Baptiste Fourier (1824).
Global warming would seem to imply that the whole atmospheric system is warming up as a result of the greenhouse effect, but this is far from certain. Once the nature of the problem has been outlined, three main areas of investigation will be addressed. First, there is the scientific evidence for global warming; second, the study of the likely impacts and third, the formulation and implementation of strategies to cope with such impacts. The contribution of geographers has chiefly been in the applied field of impact studies.
THE NATURE OF THE PROBLEM
The greenhouse effect
The ‘natural’ greenhouse effect occurs because some of the gases present in the atmosphere are largely transparent to incoming solar radiation but not to outgoing radiation, which is partially absorbed by water vapour, and the three main greenhouse gases. Their current percentage contributions are 70 per cent for carbon dioxide, 23 per cent for methane and 7 per cent for nitrous oxide. Water vapour is very variable in time and space. CFCs (chlorofluorocarbons) and their interaction with the variable greenhouse gas, ozone, also need to be noted as potential contributors (IPCC 1990). These gases are collectively known as ‘the greenhouse gases’. The additional amount of such gases that are present in the atmosphere as a direct or indirect result of human activity, such as power generation and vehicle emissions, leads to an ‘enhanced’ greenhouse effect.
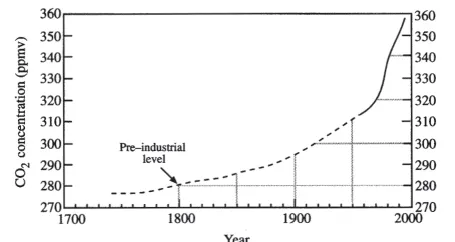
Although carbon dioxide is not the strongest absorber of outgoing long-wave terrestr ial radiation, it is believed that it has the greatest long-term potential for raising global temperatures. Most attention has therefore been directed to the increase in the concentration of carbon dioxide from 280 ppmv (parts per million by volume) at the beginning of the Industrial Revolution in the eighteenth century to current levels of 360 ppmv (Figure 2.1). The annual increase of about 1.8 ppmv adds 3.8 Gt (gigatonnes) to the atmospheric carbon reservoir of 750 Gt (Houghton 1997).This is about half of the calculated amount of 7.5 Gt being emitted into the atmosphere from forest fires and fossil fuel burning. It is generally accepted that the remainder—about 3.7 Gt. —is absorbed by the oceans.
figure 2.1 Trend line of carbon dioxide concentrations over the past 300 years based on (a) measurements from Antarctic ice core records prior to 1958 (dashed line), (b) direct measurements from the Mauna Loa observatory in Hawaii (solid line).
Source: After Houghton 1997 and IPCC WGI 1996.
The atmospheric carbon reservoir forms part of the global carbon cycle in which the natural atmosphere-ocean component has an annual throughput of about 90 Gt, while the biosphereatmosphere cycle has an annual throughput of about 100 Gt. Both show a small but significant total net loss to the atmosphere of 3.7 Gt. The total annual throughput of carbon, chiefly as carbon dioxide, in the atmosphere is therefore about 25 per cent of the atmospheric reservoir of 750 Gt. The sensitivity to change in the throughput of carbon in the atmosphere needs to be considered in any discussion of global warming, since the climatic effect of relatively small changes in atmospheric carbon could be amplified within the system.
Radiative forcing and equilibrium
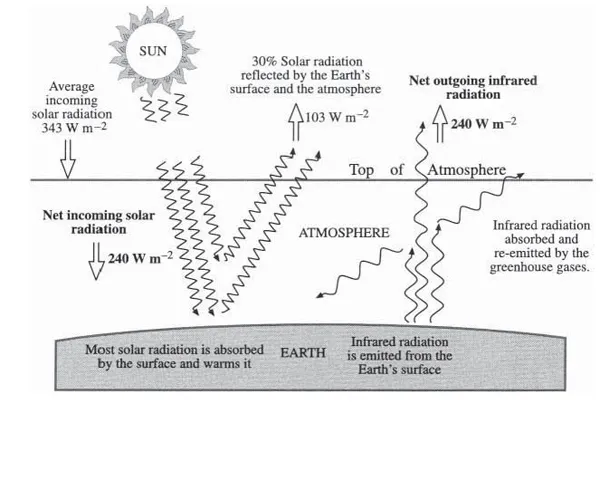
Radiative forcing may be defined as a change in average net radiation at the tropopause which is the upper boundary of the troposphere, due to changes in incoming solar or outgoing infrared radiation. Such a change ‘perturbs’ the Earth’s radiation balance, as shown in Figure 2.2, altering the balance between incoming and outgoing radiation. It also alters the nature of the greenhouse effect, which is usually expressed in degrees C (IPCC 1995). Under present climatic conditions and carbon emissions, the natural greenhouse effect amounts to about 33°C if clouds, which act as radiation ‘blankets’, areincluded in the calculations (Houghton 1997). The theoretical surface temperature has been calculated to be—18°C based on a 30 per cent value for the average reflectivity of the Earth and atmosphere.The actual global surface temperature is about 15°C— the difference represents the natural greenhouse effect. Clouds play an important but complex role in this radiation balance (IPCC1990).
Figure 2.2 Simplified diagram showing the mean annual radiative balance of the atmosphere. Radiative equilibrium is maintained since net incoming solar radiation is balanced by net outgoing infrared radiation (240 Wm-2). Total earth-atmosphere albedo is about 30 per cent (103/343×100). The natural greenhouse effect (33°C), shown qualitatively as infrared radiation, is absorbed and partially re-radiated back to the surface.
It is customary in studying possible scenarios of a future global climate to model a doubling of the pre-industrial (1750) carbon dioxide concentration of 280 ppmv, or its radiative equivalent. At the current rate of increase in greenhouse gas emissions under a business-as-usual scenario, doubling might occur between 2070 and 2100 (IPCC 1995). Conservative radiation models of the climate system indicate an initial rise of 1.3°C for a doubling of carbon dioxide, which is equivalent to 4 W m-2 (Watts per square metre). This would mean an initial fall in outgoing radiation from 240 to 236 W m-2, which would need to be restored to 240 W m-2 to maintain radiation equilibrium. This assumes that there is no change in the average amount of solar energy reaching the outer edge of the atmosphere, which is about 1,370 W m-2 (IPCC 1990). This value is referred to as ‘the solar constant’.
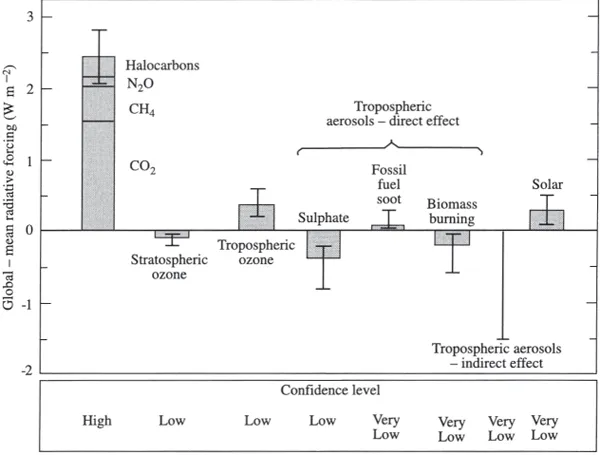
One way of indicating the effect on the radiative balance of greenhouse gases and other components is to express this in terms of radiative forcing (W m-2) from pre-industrial times to the present. Figure 2.3 shows estimates of the annually averaged radiative forcing due to human activity over this period. It also shows the natural changes in solar output from 1850 to the present (IPCC WGI1996). The first column portrays the summed effect of carbon dioxide, methane, nitrous oxide and the halocarbons (CFCs). The radiative forcing is about 2.6 W m-2 or 0.8°C, with an error bar of 0.8 W m-2. The error bar indicates the range of current estimates by models, while the confidence level is shown as a subjective assessment by Houghton (1997). It can be seen that the level of confidence is low for both tropospheric aerosols and solar variability. Expressing the radiative forcing effect in this way has led to the concept of global warming potential (GWP), which is defined as the ratio of the enhanced greenhouse effect of any gas compared with that of carbon dioxide. GWP is then used as a basis for ‘trade-offs’ in which the increase of the GWP of one gas can be offset against a similar reduction in the GWP of another gas (see Box 2.3). This is very similar to the ‘bubble’ principle of pollution credits in the USA (Elsom 1992) and an integral part of the 1997 Kyoto Agreement on emission regulation.
Figure 2.3 Estimates of the globally and annually averaged anthropogenic radiative forcing in W m-2 due to changes in concentrations of greenhouse gases and aerosols from a pre-industrial base (CO2 concentration of 280 ppmv) to 1992. Estimated solar output changes are from 1850 to 1990 (0.02% of the mean solar constant). The shaded rectangular bars represent mid-range estimates of radiative forcing—both positive and negative.
Source: Houghton 1997.
Internal feedbacks in the climate system— examples
The debate about internal changes is largely concerned with feedback processes, which may be initiated or enhanced through radiative forcing. Positive feedback tends to increase the rate of a process such as global warming. Long-term positive feedback mechanisms could prove destructive. The IPCC Report (1990) provides an example of a Sahelian drought-type positive feedback, where a drier surface resulting from rising temperatures leads to reduced evaporation, which in turn reduces humidity and cloud cover, promoting greater warming and yet drier surface conditions. If there were no restraining or counter-processes taking place, the Earth might be faced with a ‘runaway’ greenhouse effect as has occurred on Venus, where surface temperatures of about 525°C have been recorded by the Russian space probes (Houghton 1997). Negative feedback occurs when there are constant checks to the rate of a process. For example, rising sea-surface temperatures (SSTs) would increase evaporation, which in turn would increase the water vapour content in the lowest layers of the atmosphere. This could lead to greater spatial cloud coverage, decreasing the amount of incoming radiation reaching the surface, which in turn would lead to cooling of the Earth’s surface. The climate system is dominated by numerous positive and negative feedbacks, some not operating until a threshold is passed such as an SST of 27°C for tropical storm development, others operating in a non-linear or quasi-stochastic manner.
EVIDENCE FOR GLOBAL WARMING
Global data sets: land
The collection and quality control of climatic records, especially the long-term near surface temperature data, have been basic requirements of the scientific community in its task of accumulating evidence for climate change. Since few instrumental records of land surface temperatures existed until about 1850, it is current practice to emphasise the trends in global temperatures from 1861 onwards, when surface observing networks were becoming established in many parts of the world. In the late 1980s, three research groups produced similar analyses of hemispheric land surface air temperature variations—Jones et al. (1986a and b) at UEA, UK; Hansen and Lebedeff (1987) at GISS, USA; and Vinnikov et al. (1987) of SHI in the former USSR, of which the updated and re-analysed data set of Jones et al. has been used in recent studies (IPCC WGI 1996).
Global data sets: oceans
Since the oceans comprise over 60 per cent of the Northern Hemisphere and over 80 per cent of the Southern Hemisphere, it is important to assemble an accurate data set.The collection and correction of global SST data have been undertaken most recently by Folland and Parker (1995) of the UK Meteorological Office. They have produced improved adjustments to temperature records where canvas and wooden buckets were used to sample sea water temperatures from ships from about 1860 to 1941. It is now thought that sampling of SSTs at night might be more reliable. This would avoid any bias due to daytime heating of ships’ decks. There are also spatial gaps in the data, particularly over the southern oceans, and temporal gaps, especially in the nineteenth century and during the world wars. Except since 1975, SSTs appear to have lagged behind changes in land temperatures by several years (IPCC 1990).
Global data sets: combined land and ocean
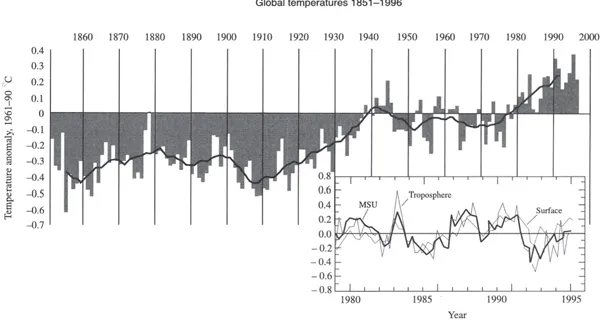
The global data record of surface land and sea temperatures is shown in Figure 2.4. It indicates the two main warming periods that have taken place since 1860, the first from 1910 to 1941 and the second from 1978 to the present Although not shown on the graph, 1997 was the warmest year to date. The correlation of this record with that of the steady rise in CO2 (see Figure 2.1) is only approximate. It implies that the climate system is responding in a complex way to direct radiative forcing through increased CO2.
Figure 2.4 Changes in global average surface air temperature over land and sea (1851–1996) relative to the averaging period 1961–90. The solid curve represents the ten-year RM plotted mid-period. Inset: Comparison of globally averaged temperatures shown as departures from the 1979–94 average for (a) the MSU (Microwave Sounding Unit) channel ...