The world's population is expected to increase to over 8 billion by 2020. About 60% of the total population of the world lives in coastal areas and 65% of the cities with a population of over 2.5 million are located in coastal areas. Written by an international panel of experts in the fields of engineering and risk management, The Handbook of Coastal Disasters Mitigation presents a coherent overview of 10 years of coastal disaster risk management and engineering, during which some of the most relevant events of recent time have taken place, including the Indian Ocean tsunami, hurricanes Katrina and Sandy in the United States or the 2011 Japanese tsunami.
- International case studies offer practical lessons on how disaster resilience can be improved in the future
- Contains tools and techniques for analyzing and managing the risk of coastal disasters
- Provides engineering measures for mitigating coastal vulnerability to tsunamis, tropical cyclones, and hurricanes
- Includes crucial tactics for rehabilitation and reconstruction of the infrastructure
Trusted by 375,005 students
Access to over 1.5 million titles for a fair monthly price.
Tomoya Shibayama Department of Civil and Environmental Engineering, Waseda University, Tokyo, Japan
Abstract
A large tsunami generated and propagated along the Indian Ocean on December 26, 2004, resulting in a large number of casualties. As a consequence, the author led a number of field surveys in Sri Lanka, Indonesia and Thailand, to identify damage mechanisms and survey inundation and run-up heights. The maximum surveyed tsunami height for the tsunami was 48.9 m at Rhiting, Banda Aceh, Indonesia. From the survey results, a variety of disaster mechanisms were found in different locations, with local socio-economic and geographical conditions having a big influence on disaster patterns. In order to promote an appropriate post tsunami rehabilitation and environmental restoration process, cooperative work with local engineers and local university professors is essential since the restoration process should take into account the local social and natural conditions of a given area. Furthermore, to establish a reliable disaster prevention system not only appropriate protection structures but also a clear and realistic evacuation plan should be designed for residents of coastal areas.
Keywords
Tsunami
Indian Ocean
Sri Lanka
Indonesia
Aceh
Hambantota
Leupung
2004
48.9 m
Rhiting
Polhena
1 Introduction
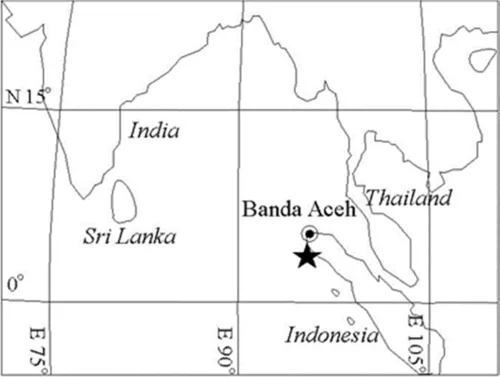
On December 26, 2004, a large undersea Mw 9.1 (USGS) megathrust earthquake with an epicenter off the cost of Sumatra (Indonesia) generated a major tsunami wave that propagated over the Indian Ocean and attacked the coasts of Sri Lanka, Indonesia, Thailand, India and the Maldives, amongst other countries. Figure 1 shows a general view of the tsunami affected area in the Indian Ocean, together with the location of the tsunami origin. Indonesia is one of the most tectonically active countries in the world, as it forms the meeting point of several plates. Essentially, the subduction of the Indian oceanic plate under the Eurasian continental plate has formed a chain of volcanoes in the western side of Indonesia, explaining the high frequency of earthquakes and powerful eruptions. Such eruptions include, for example, the case of Krakatoa, which killed over 36,000 people in 1883 when three quarters of the island blew up, generating a tsunami that has been estimated to be over 40 m in height.
Figure 1 Overview of tsunami affected area. The location of the tsunami origin is indicated as a
in the figure.
The megathrust earthquake that caused what has also been called the “Boxing Day Tsunami” was unusually large in geological extent, and it was estimated that the fault was around 1,600 km long and slipped around 15 m in two phases over a period of several minutes. As a result the sea floor is estimated to have risen by several meters, triggering the tsunami. It is worth noting that the tsunami eventually reached Africa, killing small numbers of people even in countries such as Tanzania. Overall, the numbers of victims (including those who perished and are still missing) was over 230,000, making it one of the most deadly natural disasters in recorded history.
As many chapters in the present book will discuss tsunamis, it is worth remembering that essentially tsunamis are generated when the seabed rises or subsides as a consequence of an earthquake, causing the volume of water on top of it to also move and thus creating a wave. Tsunami waves have very long periods, explaining why their behavior is very different to that of wind waves and typically result in large scale inundation and devastation. Following the 2011 Tohoku Earthquake Tsunami the Japanese Coastal Engineering Community has started to classify tsunami events into two different levels (Shibayama et al., 2013), according to their level of severity and intensity. Level 1 events have a return period of several decades to 100 + years and would be relatively low in height, typically with inundation heights less than 7-10 m. Level 2 events are less frequent, typically occurring every few hundred to a few thousand years. The tsunami inundation heights would be expected to be much bigger, typically over 10 m, but would include events of up to 20-30 m in height. The 2004 Indian Ocean tsunami clearly constitutes a level 2 event, based on the high inundation heights recorded at many locations (as will be described in the present chapter) and the low frequency of such an event.
In order to clarify the disaster mechanisms of the event, a number of surveys were performed over the disaster area to measure inundation heights and run-up, identify disaster patterns and further understand the behavior of local residents. In the remaining part of this chapter two major surveys carried out to document the disaster mechanism and storm surge heights are described, one in Sri Lanka and the other in the Banda Aceh region.
2 Methodology and Description of Basic Tsunami Parameters
The main aim of the surveys was to record the distribution of tsunami trace heights as well as to understand the situation of the damaged area. At each tsunami trace the precise location of the point was measured with surveying instruments. The tsunami traces were identified by broken branches, debris on trees, watermarks left on structures and eyewitness accounts. Section transects were taken to identify the distance from each point to the sea, and, where possible, the maximum run-up height in nearby hills or elevated terrain was also measured. All surveyed areas used the sea level at the time of the survey as the basis for the measurements taken, and later the level of the tide at the time of the survey and when the tsunami struck were taken into account.
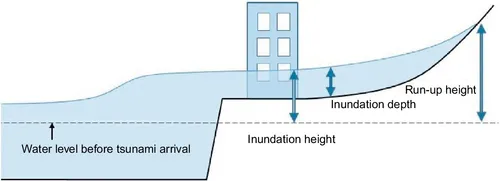
Figure 2 shows a diagrammatic representation of a typical “ideal” transect. The diagram also shows the concepts of run-up and inundation heights, which are very important to understand tsunami destruction patters. As these concepts will be used by many authors in other chapters (see Chapters 5, 6, 9, 10, 11 or 15, for example) it is worth describing them in a bit more detail in this section.
Figure 2 Definitions of inundation height, run-up height, and inundation depth.
Tsunami waves are typically generated in relatively deep seas, and propagate quickly across the ocean. While propagating in deep seas they cause little damage, as they are typically only a few dozen centimeters in height. However, as they approach the coastline the wave starts to transform in a series of processes know as wave shoaling. Essentially as the water depth decreases, the wave speed decreases and the friction of the seabed starts to affect the wave shape, rapidly increasing the height of the tsunami, though resulting in a decrease in its wavelength. This increase in wave height is given by the following equation (Green’s formula):
where Hs and Hd are wave heights in shallow and deep water and hs and hd are the depths of the shallow and deep water.
According to this equation, a tsunami with a height of 1 m in the open ocean where the water depth is 4000 m would have a wave height of 4 to 5 m in a water depth of 10 m. Although the wave is slowed down considerably (with respect to its velocity in deep seas) it still has considerable kinetic energy. Video footage from the 2004 Indian Ocean Tsunami and 2011 Tohoku Earthqua...
Table of contents
Cover image
Title page
Table of Contents
Copyright
Contributors
Acknowledgments
Preface
Introduction: Lessons from the Last 10 Years of Coastal Disasters
Part I: Analysis of Recent Disasters
Part II: Assessments of Vulnerability
Part III: Mitigation Measures (Structural Measures)
Part IV: Mitigation Measures (Soft Measures)
Part V: Post-Disaster Reconstruction
Part VI: Climate Change Influence on Coastal Disasters
Index
Frequently asked questions
Yes, you can cancel anytime from the Subscription tab in your account settings on the Perlego website. Your subscription will stay active until the end of your current billing period. Learn how to cancel your subscription
No, books cannot be downloaded as external files, such as PDFs, for use outside of Perlego. However, you can download books within the Perlego app for offline reading on mobile or tablet. Learn how to download books offline
Perlego offers two plans: Essential and Complete
Essential is ideal for learners and professionals who enjoy exploring a wide range of subjects. Access the Essential Library with 800,000+ trusted titles and best-sellers across business, personal growth, and the humanities. Includes unlimited reading time and Standard Read Aloud voice.
Complete: Perfect for advanced learners and researchers needing full, unrestricted access. Unlock 1.5M+ books across hundreds of subjects, including academic and specialized titles. The Complete Plan also includes advanced features like Premium Read Aloud and Research Assistant.
Both plans are available with monthly, semester, or annual billing cycles.
We are an online textbook subscription service, where you can get access to an entire online library for less than the price of a single book per month. With over 1.5 million books across 990+ topics, we’ve got you covered! Learn about our mission
Look out for the read-aloud symbol on your next book to see if you can listen to it. The read-aloud tool reads text aloud for you, highlighting the text as it is being read. You can pause it, speed it up and slow it down. Learn more about Read Aloud
Yes! You can use the Perlego app on both iOS and Android devices to read anytime, anywhere — even offline. Perfect for commutes or when you’re on the go. Please note we cannot support devices running on iOS 13 and Android 7 or earlier. Learn more about using the app
Yes, you can access Handbook of Coastal Disaster Mitigation for Engineers and Planners by Miguel Esteban,Hiroshi Takagi,Tomoya Shibayama in PDF and/or ePUB format, as well as other popular books in Technology & Engineering & Geography. We have over 1.5 million books available in our catalogue for you to explore.