- 952 pages
- English
- ePUB (mobile friendly)
- Available on iOS & Android
eBook - ePub
Renewable Energy
About this book
This third edition of Renewable Energy is undoubtedly one of the most complete accounts of the subject, from source through to extraction and use. The book is academically rigorous, but accessible.The author first describes the effect of the sun on the atmosphere and the creation of wind and waves, including the effects of global warming. For each type of renewable energy, from direct solar radiation to wind and biomass, there follows a technical description of the devices that can be used to transform the energy into useful forms. The author explores new solar cell types, including polymer and organic cells, new biofuel processes and new wave energy devices.The final part of the book loos at social and economic aspects of renewable energy – the costs of our current fuel bills versus new energy sources, and the difference it could make to developing as well as developed countries. The concept of whole new energy systems based around wind, solar, and other energies is put into a real-life context. Key features include: ·Reference paths: the reader may follow the general process from source through to distribution, or concentrate on a specific type of energy.·The material is divided into undergraduate text and advanced options.·Details the significant expansion of the field since the publication of the previous edition.·Updated material includes offshore wind technologies, polymer and organic solar cells, new developments in hydrogen storage, pipeline transmission, biofuel processes, and wave energy devices, evaluation of biomass options, and an outlook on the renewable energy market.* The only rigorous theory and applications book available * Provides the principles of renewable energy flows/sources and energy conversion processes* Details the significant expansion of the field since the publication of the previous editions
Tools to learn more effectively

Saving Books

Keyword Search

Annotating Text

Listen to it instead
Information
CHAPTER 1
PERSPECTIVES
1.1 Current penetration of renewable energy technologies in the marketplace
The penetration of renewable energy into the energy system of human settlements on Earth is from one point of view nearly 100%. The energy system seen by the inhabitants of the Earth is dominated by the environmental heat associated with the greenhouse effect, which captures solar energy and stores it within a surface-near sheet of topsoil and atmosphere around the Earth. Only 0.02% of this energy system is currently managed by human society, as illustrated in Fig. 1.1. Within this economically managed part of the energy sector, renewable energy sources currently provide about 25% of the energy supplied. As the figure indicates, a large part of this renewable energy is in the form of biomass energy, either in food crops or in managed forestry providing wood for industrial purposes or for incineration (firewood used for heat and cooking in poor countries or for mood-setting fireplaces in affluent countries, residue and waste burning in combined power and heat plants or incinerators). The additionally exploited sources of renewable energy include hydro, wind and solar. Hydropower is a substantial source, but its use is no longer growing due to environmental limits identified in many locations with potential hydro resources. Passive solar heating is a key feature of building design throughout the world, but active solar heat or power panels are still at a very minute level of penetration. Also, wind has both a passive and an active role. Passive use of wind energy for ventilation of buildings plays a significant role, and active power production by wind turbines is today a rapidly growing energy technology in many parts of the world. The highest penetration reaching nearly 20% of total electricity provided is found in Denmark, the country pioneering modern wind technology. Further renewable energy technologies, so far with small global penetration, include biofuels such as biogas and geothermal power and heat. As indicated in Fig. 1.1, the dominant energy sources are still fossil fuels, despite the fact that they are depletable and a cause of frequent national conflicts, due to the mismatch between their particular geographical availability and demand patterns.
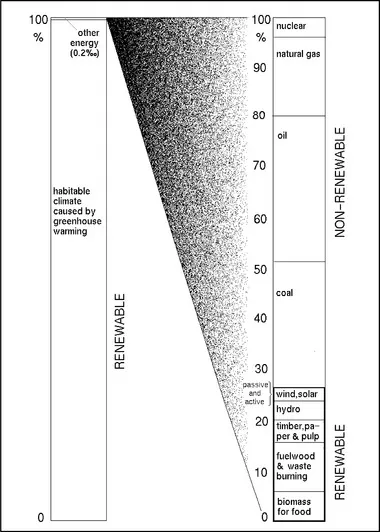
Figure 1.1. Renewable energy in the global energy system. (Sørensen, 1992c)
From a business point of view, the total renewable energy flows, including free environmental heat, are, of course, not quite as interesting as the energy that can be traded in a market. Current renewable energy markets comprise both consumer markets and markets driven by government demonstration programmes and market-stimulating subsidy schemes. The reason for the initial support is partly industrial policy, aimed at getting new industry areas started, and partly a question of compensation for market distortions created by the fact that conventional energy industries are not fully paying for the negative environmental impacts caused by their products. This is a complex issue, partly because of the difficulty in exact determination of external costs and partly because most countries already levy taxation on energy products that may in part be contributing towards paying for the environmental damage, but often is just a government revenue not specifically used to offset the negative effects associated with using fossil or nuclear fuels (read more about these issues in Chapter 7).
The current penetration of active uses of renewable energy in national energy systems is growing, and Figures 1.2–1.14 show the values for the year 2000, which may serve as a reference year for assessing newer data. In cases where the growth rate is particular high, its annual value is mentioned in the caption to the figure showing the national distribution of markets.
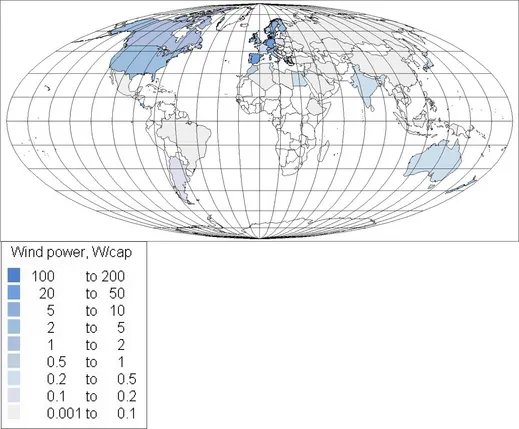
Figure 1.2. Wind power production. National average values for the year 2000 are shown, based upon BTM (2001) and an average capacity factor of 0.3. The world average for the year 2000 is 0.92 W/cap. The growth in cumulated installed capacity from 2000 to 2001 was 35% (BTM, 2002). Some observers expect the growth to slow during the following years, for economic and political reasons, but then to resume growth (Windpower Monthly, 2003).
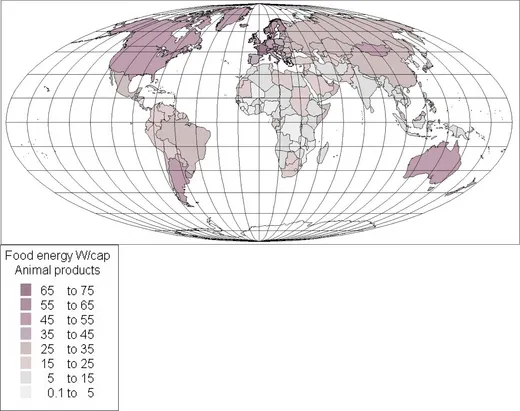
Figure 1.3. Biomass energy contained in human time-averaged food intake of animal products. National average values for the year 2000 are shown (FAO, 2003). The world average animal-based food intake for the year 2000 is 22.2 W/cap.
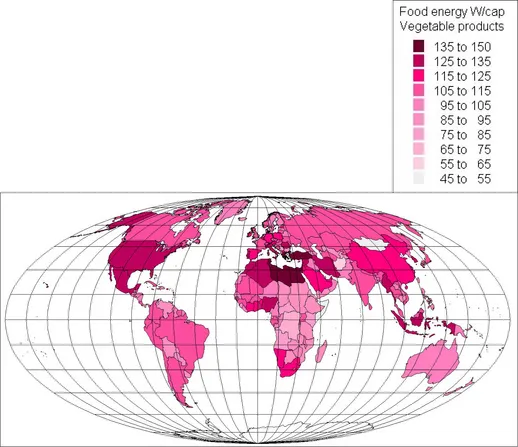
Figure 1.4. Biomass energy contained in human time-averaged food intake of vegetable products. National average values for the year 2000 are shown (FAO, 2003). The world average vegetable food intake for the year 2000 is 113.7 W/cap.
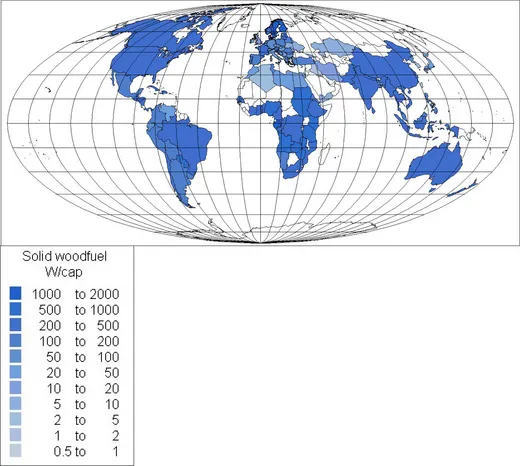
Figure 1.5. Biomass energy contained in woodfuel. National average values for the year 2000 are shown (OECD/IEA, 2002a, 2002b). The world average woodfuel use in the year 2000, implied by the data, is 221.9 W/cap. No woodfuel use is reported for Russia. Some other countries are not covered by the data source.
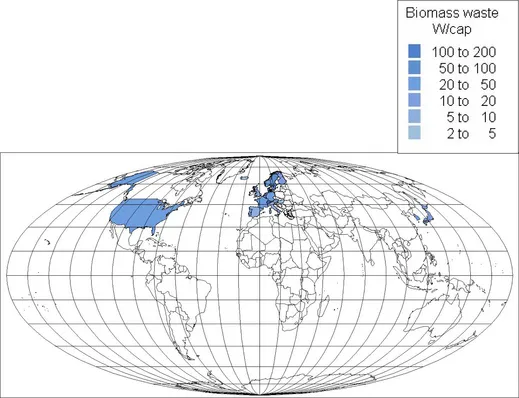
Figure 1.6. Energy in biomass waste (refuse) utilised for power or heat production. National average values for the year 2000 are shown, based upon OECD/IEA (2002a, 2002b). The world average for the year 2000 is 3.7 W/cap.
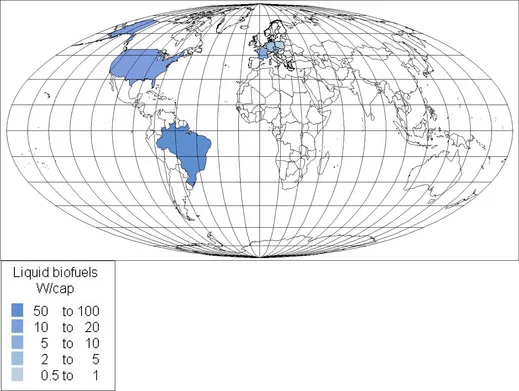
Figure 1.7. Energy in liquid biofuels (presently ethanol and biodiesel). National average values for the year 2000 are shown, based upon EC-ATLAS (2003) and OECD/IEA (2002a, 2002b). The world average for the year 2000 is 2.3 W/cap.
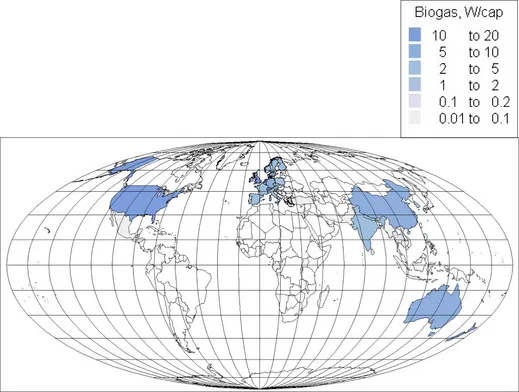
Figure 1.8. Energy in biogas. National average values for the year 2000 are shown, based upon converting the number of units (FAO-Asia, 2003), assuming on average for each family unit a biogas production of half that of an optimally working unit fed manure from the equivalent of 2.5 cows and producing 1736 W of biogas. Additional data are from OECD/IEA (2002a, 2002b). The world average for the year 2000 is 2.8 W/cap.
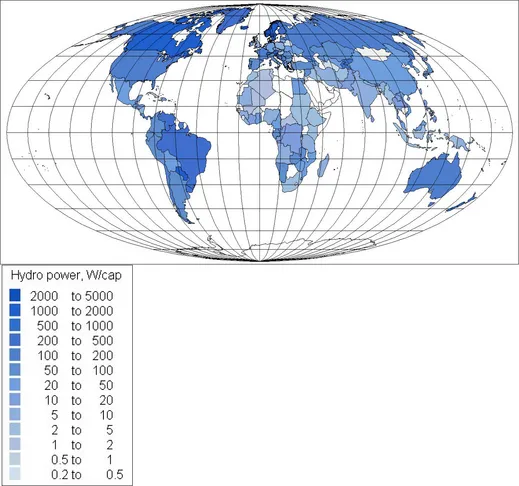
Figure 1.9. Hydropower. National average values for the year 2000 are shown, based upon OECD/IEA (2002a, 2002b) and installed power data from Aqua-Media (1997) for countries not covered by IEA, using estimated capacity factors of 0.2 to 0.4. The world average for the year 2000 is 50 W/cap.
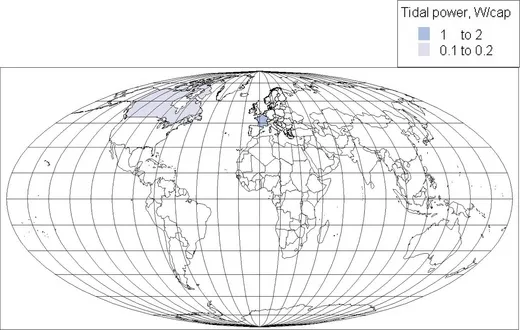
Figure 1.10. Tidal power. National average values for the year 2000 are shown, based upon OECD/IEA (2002a, 2002b). The world average for the year 2000 is 0.01 W/cap.
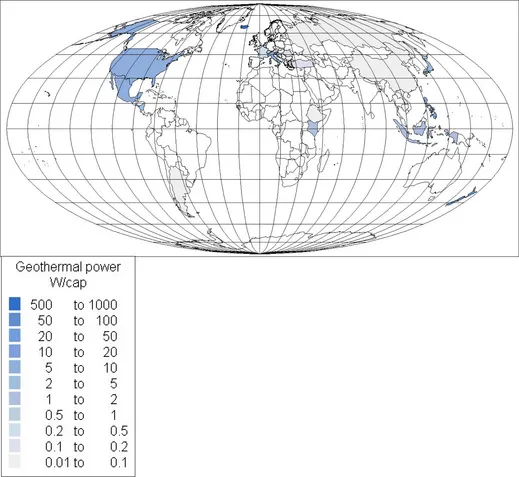
Figure 1.11. Geothermal power. National average values for the year 2000 are shown, based upon either 10% of heat input given in OECD/IEA (2002a, 2002b) or 60% of installed power from Barbier (1999). The world average for the year 2000 is 9.3 W/cap.
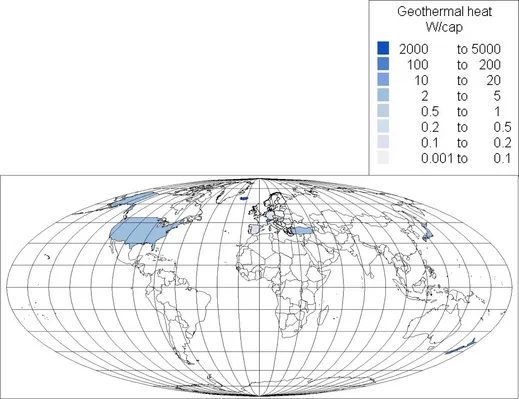
Figure 1.12. Geothermal heat (mainly district heating). National average values for the year 2000 are shown, based upon OECD/IEA (2002a, 2002b). The world average for the year 2000 is 0.5 W/cap.
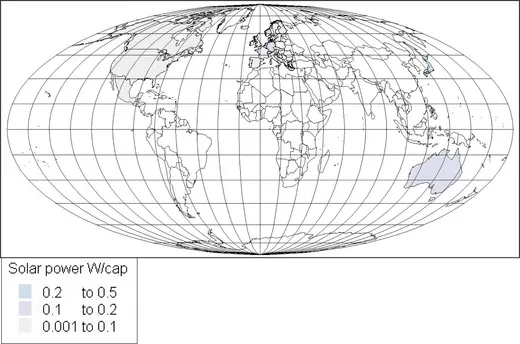
Figure 1.13. Solar power. National average values for the year 2000 are shown, based upon OECD/IEA (2002b) or an average energy production equal to 10% of the installed capacity given in IEA-PVPS (2001). The world average for the year 2000 is 0.007 W/cap. The growth rate from 2000 to 2001 was 35% (IEA-PVPS, 2002).
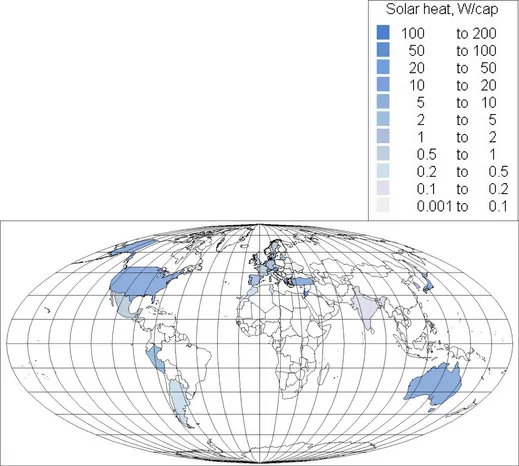
Figure 1.14. Solar heat. National average values for the year 2000 are shown, based upon IEA (2002). Both building-integrated and central district heating thermal systems are included. The world average for the year 2000 is 0.11 W/cap.
As Table 1.1 shows, at a global average of 222 W/cap., the traditional use of biomass for combustion is still the dominating use of renewable energy, although it takes more efficient forms in many industrialised countries. Only slightly less (146 W/cap.) is the use of food energy in biomass of animal or vegetable origin (the nutrient value of food being, in any case, more than that of the energy it provides). Next comes hydropower (50 W/cap.) and then geothermal power, which only in part can be classified as renewable (as many steam reservoirs are exploited at a rate that will exhaust the reservoir over periods of decades). At the level of 1 W/cap., i.e. two orders of magnitude under the energy in food intake, one finds biomass waste (used for power or heat), biogas, liquid biofuels (used in the transportation sector), wind power and geothermal heat (used for district heating). At the bottom comes...
Table of contents
- Cover image
- Title page
- Table of Contents
- Other books by the author
- Copyright
- Preface to third edition
- Preface to second edition
- Preface to first edition
- Units and conversion factors
- Chapter 1: PERSPECTIVES
- Chapter 2: THE ORIGIN OF RENEWABLE ENERGY FLOWS
- Chapter 3: THE INDIVIDUAL ENERGY SOURCES
- Chapter 4: THE ENERGY CONVERSION PROCESSES
- Chapter 5: ENERGY TRANSMISSION AND STORAGE
- Chapter 6: ENERGY SUPPLY SYSTEMS
- Chapter 7: SOCIO-ECONOMIC ASSESSMENT OF ENERGY SUPPLY SYSTEMS
- Chapter 8: WINDING UP
- REFERENCES
- SUBJECT INDEX
Frequently asked questions
Yes, you can cancel anytime from the Subscription tab in your account settings on the Perlego website. Your subscription will stay active until the end of your current billing period. Learn how to cancel your subscription
No, books cannot be downloaded as external files, such as PDFs, for use outside of Perlego. However, you can download books within the Perlego app for offline reading on mobile or tablet. Learn how to download books offline
Perlego offers two plans: Essential and Complete
- Essential is ideal for learners and professionals who enjoy exploring a wide range of subjects. Access the Essential Library with 800,000+ trusted titles and best-sellers across business, personal growth, and the humanities. Includes unlimited reading time and Standard Read Aloud voice.
- Complete: Perfect for advanced learners and researchers needing full, unrestricted access. Unlock 1.4M+ books across hundreds of subjects, including academic and specialized titles. The Complete Plan also includes advanced features like Premium Read Aloud and Research Assistant.
We are an online textbook subscription service, where you can get access to an entire online library for less than the price of a single book per month. With over 1 million books across 990+ topics, we’ve got you covered! Learn about our mission
Look out for the read-aloud symbol on your next book to see if you can listen to it. The read-aloud tool reads text aloud for you, highlighting the text as it is being read. You can pause it, speed it up and slow it down. Learn more about Read Aloud
Yes! You can use the Perlego app on both iOS and Android devices to read anytime, anywhere — even offline. Perfect for commutes or when you’re on the go.
Please note we cannot support devices running on iOS 13 and Android 7 or earlier. Learn more about using the app
Please note we cannot support devices running on iOS 13 and Android 7 or earlier. Learn more about using the app
Yes, you can access Renewable Energy by Bent Sorensen,Bent Sørensen in PDF and/or ePUB format, as well as other popular books in Technology & Engineering & Environmental Science. We have over one million books available in our catalogue for you to explore.