Handbook of Energy
eBook - ePub

Handbook of Energy

Diagrams, Charts, and Tables

  1. 1,034 pages
  2. English
  3. ePUB (mobile friendly)
  4. Available on iOS & Android
eBook - ePub

Handbook of Energy

Diagrams, Charts, and Tables

Book details
Book preview
Table of contents
Citations

About This Book

Handbook of Energy, Volume I: Diagrams, Charts, and Tables provides comprehensive, organized coverage on all phases of energy and its role in society, including its social, economic, political, historical, and environmental aspects. While there is a wealth of information about energy available, it is spread across many books, journals, and websites and it tends to target either a particular form of energy or a specific audience. Handbook of Energy provides a central repository of information that meets diverse user communities. It focuses on visual, graphic, and tabular information in a schematic format. Individuals and researchers at all educational levels will find the Handbook of Energy to be a valuable addition to their personal libraries.

  • Easy-to-read technical diagrams and tables display a vast array of data and concepts

Frequently asked questions

Simply head over to the account section in settings and click on “Cancel Subscription” - it’s as simple as that. After you cancel, your membership will stay active for the remainder of the time you’ve paid for. Learn more here.
At the moment all of our mobile-responsive ePub books are available to download via the app. Most of our PDFs are also available to download and we're working on making the final remaining ones downloadable now. Learn more here.
Both plans give you full access to the library and all of Perlego’s features. The only differences are the price and subscription period: With the annual plan you’ll save around 30% compared to 12 months on the monthly plan.
We are an online textbook subscription service, where you can get access to an entire online library for less than the price of a single book per month. With over 1 million books across 1000+ topics, we’ve got you covered! Learn more here.
Look out for the read-aloud symbol on your next book to see if you can listen to it. The read-aloud tool reads text aloud for you, highlighting the text as it is being read. You can pause it, speed it up and slow it down. Learn more here.
Yes, you can access Handbook of Energy by Cutler J. Cleveland,Christopher G. Morris in PDF and/or ePUB format, as well as other popular books in Physical Sciences & Energy. We have over one million books available in our catalogue for you to explore.

Information

Year
2013
ISBN
9780080914572
Part I
Sources
Section 1 Bioenergetics
Section 2 Biomass
Section 3 Hydropower
Section 4 Wind
Section 5 Coal
Section 6 Oil and Gas
Section 7 Electricity
Section 8 Nuclear
Section 9 Renewables
Section 10 Solar
Section 11 Photovoltaic
Section 12 Geothermal
Section 13 Hydrogen
Section 14 Fuel Cells
Section 15 Ocean Energy
Section 1

Bioenergetics

Figures

image
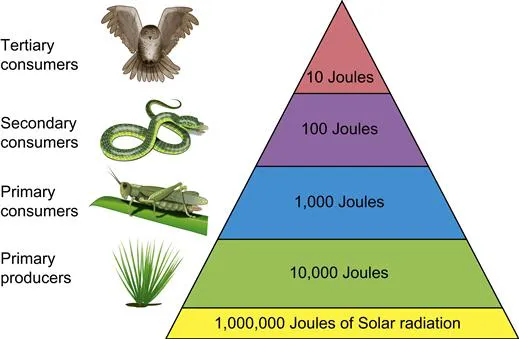
Figure 1.1 Ecological or energy pyramid, with amount of energy at each trophic level.
image
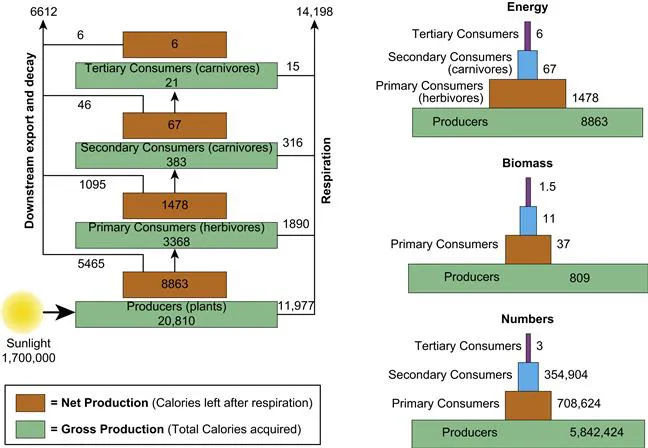
Figure 1.2 The flow of energy through a river ecosystem in Silver Springs, Florida. Energy units are kilocalories per square meter per year (kcal/m2/yr). Biomass units represent the dry weight of organic matter (per square meter). The pyramid of numbers is derived from a census of the populations of autotrophs, herbivores, and two levels of carnivores on an acre (0.4 hectare) of a typical grassland. The figures represent number of individuals counted at each trophic level. Source: Energy data from Odum, Howard T. 1957. Trophic Structure and Productivity of Silver Springs, Florida. Ecological Monographs 27:55–112; adapted from Kimball, John W., Kimball’s Biology Pages, <http://users.rcn.com/jkimball.ma.ultranet/BiologyPages/W/Welcome.html>.
image
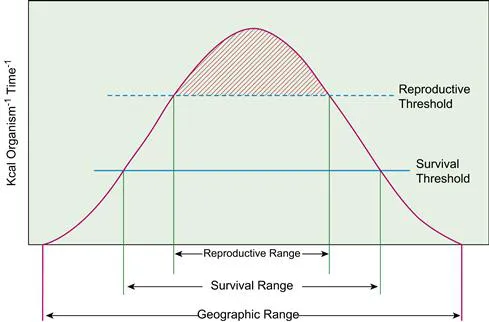
Figure 1.3 Organisms have ranges of tolerance for environmental factors (sunlight, temperature, pH, ec.). Optimum conditions are those that are most favorable for an organism to survive, grow and reproduce. This optimum is somewhere within the range of tolerance for that organism. Source: Adapted from Hall, C.A.S., J.A. Stanford and R. Hauer. 1992. The distribution and abundance of organisms as a consequence of energy balances along multiple environmental gradients. Oikos 65: 377–390.
image
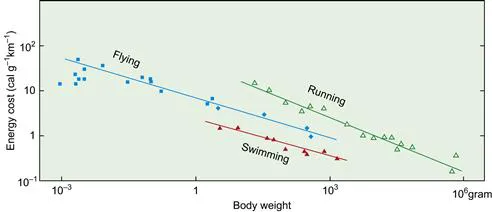
Figure 1.4 Energy cost of locomotion for swimming, flying, and running animals, as a function of body size. Source: Data from Schmidt-Nielsen, K. 1972. Locomotion: energy cost of swimming, flying and running. Science 177, 222–228.
image
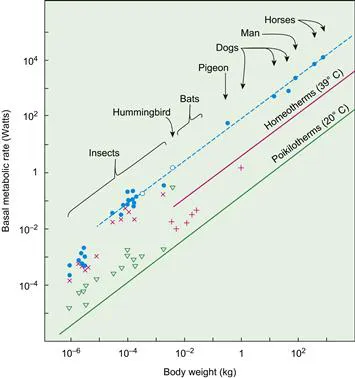
Figure 1.5 The relation between basal metabolic rate and body weight. Source: Data from Monteith, J.L. and M.H. Unsworth. 1990. Principles of Environmental Physics (Second Edition), (London, Edward Arnold).
image
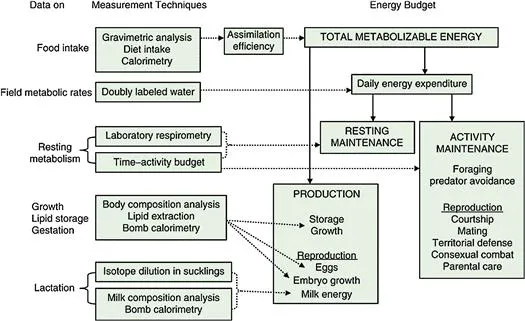
Figure 1.6 Generalized energy budget used to examine reproductive energetics. Source: Kunz, Thomas H. and Kimberly S. Orrell. 2004. Reproduction, Energy Costs of, In: Cutler J. Cleveland, Editor-in-Chief, Encyclopedia of Energy, (New York, Elsevier), Pages 423-442.
image
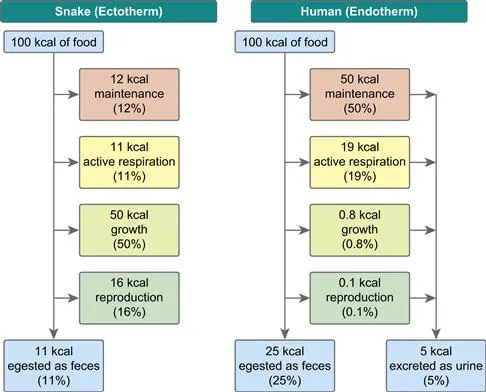
Figure 1.7 Comparative energetics of a snake (ectotherm) and human (endotherm). Source: Data from Kaufmann, Robert K. and Cleveland, Cutler J. 2007. Environmental Science (McGraw-Hill, Dubuque, IA).
image
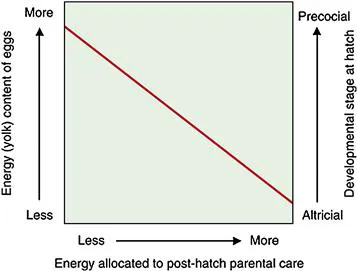
Figure 1.8 General relationship among energy content of eggs, energy allocated to post-hatch parental care, and development stage of offspring at hatch. Source: Kunz, Thomas H. and Kimberly S. Orrell. 2004. Reproduction, ...

Table of contents

  1. Cover image
  2. Title page
  3. Table of Contents
  4. Copyright
  5. Preface
  6. Acknowledgements
  7. Part I: Sources
  8. Part II: Foundations
  9. Part III: Applications
  10. Part IV: Impacts
  11. Part V: Correlations