eBook - ePub
Improving the Safety and Quality of Eggs and Egg Products
Volume 1: Egg Chemistry, Production and Consumption
- 632 pages
- English
- ePUB (mobile friendly)
- Available on iOS & Android
eBook - ePub
Improving the Safety and Quality of Eggs and Egg Products
Volume 1: Egg Chemistry, Production and Consumption
About this book
Eggs are economical and of high nutritional value, yet can also be a source of foodborne disease. Understanding of the factors influencing egg quality has increased in recent years and new technologies to assure egg safety have been developed. Improving the safety and quality of eggs and egg products reviews recent research in these areas.Volume 1 focuses on egg chemistry, production and consumption. Part one sets the scene with information on egg production and consumption in certain countries. Part two then provides essential information on egg formation and chemistry. Factors that impact egg quality are the focus of part three. Chapters cover the role of poultry breeding, hen nutrition and laying environment, among other significant topics. Part four addresses organic and free range egg production, the impact of egg production on the environment and non-poultry eggs. A chapter on processed egg products completes the volume.With its distinguished editors and international team of contributors, Volume 1 of Improving the safety and quality of eggs and egg products is an essential reference for managers in the egg industry, professionals in the food industry using eggs as ingredients and all those with a research interest in the subject.
- Focuses on egg chemistry, production and consumption with reference to the factors than can impact egg quality
- Reviews recent research in the areas of disease, egg quality and the development of new technologies to assure egg safety
- Comprehensively covers organic, free-range and processed egg production
Trusted by 375,005 students
Access to over 1.5 million titles for a fair monthly price.
Study more efficiently using our study tools.
Information
Part I
Egg production and consumption
1
Egg and egg product production and consumption in Europe and the rest of the world
P. Magdelaine, ITAVI, France
Abstract:
World egg production and consumption have been increasing for the last ten years whereas egg production in the EU has remained stable in volume. EU production systems, however, have evolved dramatically in relation to consumer expectations regarding animal welfare and the variety of products and also due to the implementation of the EU welfare regulation. The situation remains contrasting within the EU. European egg consumption amounts to 240 eggs per person per year, with strong variations among countries, and a rise in the share of egg products in global consumption. Various steering factors will determine the future of the European egg industry, such as European regulation (animal welfare, environment, sanitary requirements), feedstuff price volatility, changes in consumers' preferences and finally the conclusions of World Trade Organization (WTO) negotiations, which could lead to an opening of the European market to products (egg powder for example) from emerging countries.
Key words
egg production
market
competitiveness
consumption
1.1 Introduction
World egg production has shown strong development for the last 20 years and has, along with poultry meat production, registered the most important growth in the coverage needs of protein for the world population. This chapter will begin by discussing world egg production before presenting its dynamics for past 20 years, with some particular analysis of the main producing countries (the US and China). Trade changes such as trends in global consumption for table eggs and egg products will be analysed. The chapter will then go on to present an overview of the European egg industry, focusing on the main producing countries and on the European regulation concerning animal welfare and its impact on production and market segmentations within the European Union. The diversity of the national situations will be analysed in relation to specific national rules and contexts.
The chapter will conclude by presenting the international production costs of selected countries. It will also present their future prospects in the global and the European markets in relation to different scenarios concerning international and European policies and regulations, global and European growth and demand in egg and egg products.
1.2 Worldwide overview
1.2.1 World production
According to the FAO, world egg production reached 60.7 Mt in 2008 (i.e. 1140 billion eggs; Table 1.1). China is by far the largest producer with 22.7 Mt, i.e. 37% of the world production, followed by the EU-27 and the US. World egg production rose on average by 2.4% per year during the ten last years, compared with a 3.5% growth during the previous decade, 1987–1997. Most of the world's growth originates from traditional Asian producing countries, which represent 59% of world production and are responsible for 70% of the world growth during the last ten years.
Table 1.1
World egg production (tonnes)
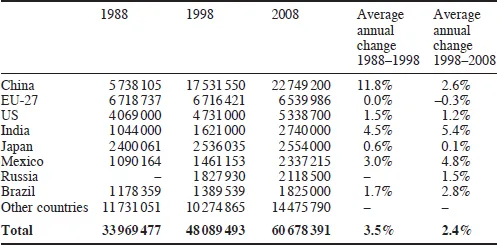
(source: FAO March 2010)
China is the main egg-producing country in the world and has shown strong development over the past 20 years, although production has slowed somewhat in the last few years. Ten Chinese provinces produced 80% of the national egg production in 2006 (vs. 70% 20 years ago). The Shandong and Hebei provinces represent a third of the Chinese production. Apart from a few areas which have large industrialized farms, Chinese farms are often little family production units, with the majority of their output going to family or local markets. A billion farms keep less than 200 hens each and produce only 10% of the Chinese production, whereas a few big farms keep (or integrate) more than a million billion hens each. Less than 5% of Chinese egg production was processed towards egg products in 2002. After a strong rise, the avian flu epidemic has slowed down the development of egg consumption since 2005-2006. Chinese egg consumption reached 333 eggs per capita in 2008 (source IEC, 2010).
The United States of America ranks in third place behind China and the EU-27. For the last ten years, US production has been more dynamic than its European counterpart (+ 1.2% a year, vs. stability in the EU). American farm sizes are also quite different from those in Europe, and very concentrated: in 2008, 255 farms kept 95% of the total 284 millions hens. Six major companies kept one-third of total livestock. According to Hans Windhorst, (2010a) the composition of the ten leading states in egg production has not changed very much for the last ten years, but the spatial pattern has changed a great deal. In 2008, Iowa ranked first with 16% of the US production, followed by Ohio (8%), Indiana (7.2%) and Pennsylvania (6.9%). Egg consumption was very high in the 1950s, around 380-400 eggs per capita but there followed a long decline until consumption reached 235 eggs per capita in 1995. For the last ten years, however, consumption has again increased and reached 248 eggs in 2008 (IEC, 2010).
1.2.2 World trade
According to FAO data, international trade reached 1.4 Mt for shell eggs, 55 000 t for egg powder and 218 000 t for liquid egg products in 2007, i.e. approximately 1.94 Mt of shell egg equivalent, intra-EU trade included. This accounts for only 3% of the global production. Nevertheless, international trade has increased during the last ten years by about 5% per year (6% per year for egg powder). Most of the trade for shell eggs and liquid egg products is within the EU. Three European countries rank in the top five exporting countries. The main shell egg exporting countries were, in 2008, the Netherlands (24% of the global trade), China (8%) and Spain (7%), followed by the US and Germany. The main importing countries were Germany (21%), followed by the Netherlands and France (12% each). The main exporting countries for liquid eggs trade were the Netherlands (40%) and France (13%).
The egg powder trade, after a strong development, has been stable for the past three years. The EU (12 400 t exported in 2007) and the US (11 300 t) are the leading exporters in this market, followed by India (7 700 t).
1.2.3 Consumption
The average consumption level in the world was assessed by the FAO to be 9.1 kg per person in 2005, which is to say about 145 eggs (Fig. 1.1). Strong variations exist according to different countries, however. For example, more than 300 eggs per capita were consumed in Japan and Mexico, 230–240 eggs in the EU and the US, and fewer than 100 eggs in most African countries and South East Asia. In developing countries, demand and supply should continue to grow more rapidly than in developed countries, due to a strong demographic growth in the former and to the already high consumption levels in most developed countries (Windhorst, 2008).
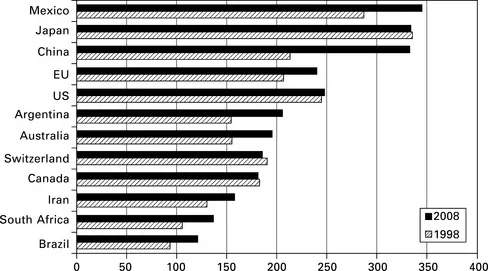
Fig. 1.1 Egg consumption levels in selected countries (egg/head 1998–2008). (source: IEC)
According to the FAO, eggs (together with poultry meat) have registered the most important growth in the coverage of protein needs for the world population in the past 20 years (Table 1.2). The high level of egg consumption in Asia can be partly explained by a low level of milk consumption. Indeed, although, on average, egg protein supply/milk protein supply ratios are around 0.6 for the world, this figure varies greatly from more than 2 in most Asian countries (5 in Korea, 3 in Thailand, 2.7 in China, 1.7 in Japan) to less than 1 in Europe and America (1.1 in Canada, 0.9 in France, 0.5 in Germany and 0.4 in the US).
Table 1.2
Protein supply quantity (g/capita/day) (g)
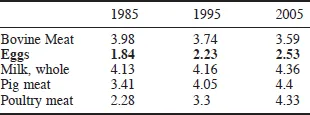
(source: FAO March 2010)
1.3 European overview
1.3.1 Production
EU-27 egg production has been quite stable for the last ten years: it was up to 6.44 Mt in 2008 and was approximately 6.25 Mt in 2009 (this is the equivalent of a little more than 102 billion eggs), with a decrease of 3% compared with 2008 (Table 1.3). The EU produces about 1.5 Mt of egg products in equivalent liquid, i.e. a little less than a quarter of European egg production. The European self-sufficiency level reached 102.3% in 2008. Egg and egg product exports reached 191 000 t shell egg equivalent in 2008, of which one-third were egg products. Import levels remain very low (24 400 t shell egg equivalent in 2008).
Table 1.3
Major European egg produc...
Table of contents
- Cover image
- Title page
- Table of Contents
- Copyright
- Contributor contact details
- Woodhead Publishing Series in Food Science, Technology and Nutrition
- Preface
- Part I: Egg production and consumption
- Part II: Egg formation, chemistry and quality parameters
- Part III: Egg production and quality
- Part IV: Alternative egg production systems and processed eggs
- Index
Frequently asked questions
Yes, you can cancel anytime from the Subscription tab in your account settings on the Perlego website. Your subscription will stay active until the end of your current billing period. Learn how to cancel your subscription
No, books cannot be downloaded as external files, such as PDFs, for use outside of Perlego. However, you can download books within the Perlego app for offline reading on mobile or tablet. Learn how to download books offline
Perlego offers two plans: Essential and Complete
- Essential is ideal for learners and professionals who enjoy exploring a wide range of subjects. Access the Essential Library with 800,000+ trusted titles and best-sellers across business, personal growth, and the humanities. Includes unlimited reading time and Standard Read Aloud voice.
- Complete: Perfect for advanced learners and researchers needing full, unrestricted access. Unlock 1.5M+ books across hundreds of subjects, including academic and specialized titles. The Complete Plan also includes advanced features like Premium Read Aloud and Research Assistant.
We are an online textbook subscription service, where you can get access to an entire online library for less than the price of a single book per month. With over 1.5 million books across 990+ topics, we’ve got you covered! Learn about our mission
Look out for the read-aloud symbol on your next book to see if you can listen to it. The read-aloud tool reads text aloud for you, highlighting the text as it is being read. You can pause it, speed it up and slow it down. Learn more about Read Aloud
Yes! You can use the Perlego app on both iOS and Android devices to read anytime, anywhere — even offline. Perfect for commutes or when you’re on the go.
Please note we cannot support devices running on iOS 13 and Android 7 or earlier. Learn more about using the app
Please note we cannot support devices running on iOS 13 and Android 7 or earlier. Learn more about using the app
Yes, you can access Improving the Safety and Quality of Eggs and Egg Products by Y Nys,M Bain,F Van Immerseel in PDF and/or ePUB format, as well as other popular books in Technology & Engineering & Food Science. We have over 1.5 million books available in our catalogue for you to explore.