Practical Three-Way Calibration is an introductory-level guide to the complex field of analytical calibration with three-way instrumental data. With minimal use of mathematical/statistical expressions, it walks the reader through the analytical methodologies with helpful images and step-by-step explanations. Unlike other books on the subject, there is no need for prior programming experience and no need to learn programming languages. Easy-to-use graphical interfaces and intuitive descriptions of mathematical and statistical concepts make three-way calibration methodologies accessible to analytical chemists and scientists in a wide range of disciplines in industry and academia.- Numerous detailed examples of slowly increasing complexity- Exposure to several different data sets and techniques through figures and diagrams- Computer program screenshots for easy learning without prior knowledge of programming languages- Minimal use of mathematical/statistical expressions
An introduction is provided to various calibration approaches: univariate, multivariate, and multiway, based on the complexity of the collected instrumental data. A basic nomenclature for the different data is introduced, using the complementary concepts of way and order. The advantages in going from classical univariate calibration to multiway calibration methodologies are discussed.
Keywords
Multivariate and multiway data; Multiway calibration advantages; Univariate
Do it your way, but do it multiway!
1.1. Calibration
According to the International Union of Pure and Applied Chemistry (IUPAC), calibration is, in a general sense, “an operation that relates an output quantity to an input quantity for a measuring system under given conditions”.1 The input quantities of our primary interest, i.e., in analytical calibration, are the concentrations of a sample constituent of interest (the analyte), while the output quantities are analytical signals or responses delivered by analytical instruments (a spectrometer, chromatograph, voltammeter, etc.). Therefore, in the present context calibration will mean the operation of relating instrumental signals to analyte concentrations.
1.2. Univariate calibration
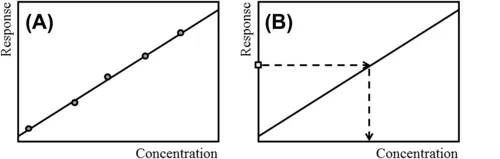
A specific case of the general calibration process is the one relating the content of a single analyte in a sample to a single value of an instrumental signal, and is called univariate calibration. In analytical chemistry, univariate calibration employs a calibration curve as a general method for the determination of the concentration of a constituent in an unknown sample.1 The calibration curve is a plot of the instrumental response as a function of the concentration of the analyte. Usually, the analyst prepares a series of standards across a range of concentrations near the expected concentration of the analyte in the unknown sample. The concentrations of the standards lie within the working range of the employed technique (Figure 1.1). Analyzing each of these standards using the chosen technique will produce a series of measurements. For most analyses, a plot of instrumental response vs analyte concentration will show a linear relationship. After measuring the response for the unknown sample, interpolation in the calibration curve allows one to find the concentration of the analyte (Figure 1.1).
1.3. Multivariate calibration
A more general calibration process involves the relationship between the concentrations of various constituents in a test sample and multiple measured responses, i.e., multivariate instead of univariate. In contrast to univariate calibration, which works with a single instrumental response measured for each experimental sample, multivariate calibration works with many different signals for each sample.
Depending on the instrumental setup, the delivered data for a single sample may have different degrees of complexity. The simplest multivariate data are those produced in vector form, i.e., as a series of responses, which can be placed one on top of each other to generate a mathematical object known as a column vector. This object is also referred as having a single “mode” or “direction”. Spectra and chromatograms are prime examples of vector data.
FIGURE 1.1(A) Univariate calibration curve showing a linear relationship between instrumental response (vertical axis) and analyte concentration (horizontal axis). Calibration standards are shown as filled circles, with the solid line implying the best fit to the calibration data. (B) Analyte prediction in an unknown sample: the dashed arrows show the process, as the measured response (open square) is interpolated in the calibration curve, leading to the estimated analyte concentration
Multivariate calibration using vectorial spectral data, particularly those measured through sample absorption in the near infrared (NIR) range, has given rise to a highly fruitful analytical field, which today is routine in many industrial laboratories and process control units.2 The literature on this field is abundant. Multiple analytes can be determined simultaneously in the presence of other, possibly unknown constituents, provided they have been properly taken into account during the calibration phase.3,4 The latter statement means that for determining an analyte in complex specimens (foodstuff, industrial materials, biological fluids, etc.) a relatively large number of calibration samples is required, in order to be able to model the effect of the interferents in new samples. The field has undoubtedly been triggered by the useful properties of NIR instruments, i.e., the ability to probe samples in a noninvasive manner.2
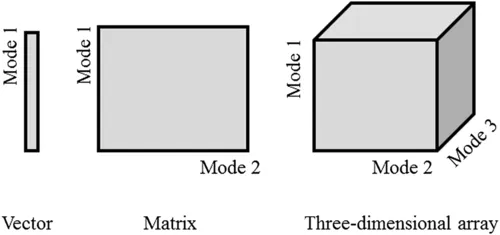
More complex data arrays than vectors are possible. The increasing complexity derives from increasingly complex instrumental setups, which generate data that can be arranged into mathematical objects with additional modes, such as a matrix or a three-dimensional array (Figure 1.2). In general, all calibration procedures developed using multiple data measured for each sample are known as multivariate. A proper classification of these calibrations depends on how the instrumental data are classified, as detailed in the next section.
FIGURE 1.2Different Objects, Which can be Built with Data Measured for a Single Sample, Indicating Their Different Modes
1.4. Nomenclature for data and calibrations
Figure 1.2 shows data objects of growing complexity. In algebraic jargon, a scalar is a zeroth-order object, a vector is first order, a matrix is second order, etc. A nomenclature exists for the different calibrations, based on the measurement of data of various orders for a single sample: zeroth-order calibration is equivalent to univariate calibration, first-order multivariate calibration is equivalent to calibration with vectorial data per sample, second-order multivariate calibration is equivalent to calibration with matrix data per sample, and third-order multivariate calibration is equivalent to calibration with three-dimensional data arrays per sample. The list may continue with data arrays with additional modes per sample.5
On the other hand, with data for a group of samples it is possible to create an array having an additional mode, the sample mode. For example, univariate measurements for several samples can be grouped to form a vector, first-order data can be placed adjacent to each other to create a matrix, etc. On this basis, an alternative nomenclature has been developed, in which calibrations are named according to the number of ways (modes) of an array for a sample set. Thus zeroth-order calibration is also one-way calibration, first order is two-way, second order is three-way, etc., and it is customary to name all calibration methodologies involving second- and higher-order data (i.e., three-way and beyond) as multiway calibration, which is thus a subdivision of multivariate calibration.
Figure 1.3 provides a compact view of the hierarchy of data and calibrations. Throughout this book, we will employ both the order-based and way-based nomenclatures for calibration.
1.5. Nomenclature for constituents and samples
In order to...
Table of contents
Cover image
Title page
Table of Contents
Copyright
Dedication
Preface
Foreword
Acknowledgments
Chapter 1. Calibration Scenarios
Chapter 2. Data Properties
Chapter 3. Experimental Three-way/Second-order Data
Chapter 4. The MVC2 Software
Chapter 5. Parallel Factor Analysis: Trilinear Data
Chapter 6. Analytical Figures of Merit
Chapter 7. Parallel Factor Analysis: Nontrilinear Data of Type 1
Chapter 9. Partial Least-Squares with Residual Bilinearization
Chapter 10. Three-way/Second-order Standard Addition
Chapter 11. Third-order/Four-way Calibration and Beyond
Chapter 12. Application Example: PARAFAC
Chapter 13. Application Example: MCR–ALS
Chapter 14. Application Example: U–PLS/RBL
Chapter 15. Solutions to Homework
Index
Frequently asked questions
Yes, you can cancel anytime from the Subscription tab in your account settings on the Perlego website. Your subscription will stay active until the end of your current billing period. Learn how to cancel your subscription
No, books cannot be downloaded as external files, such as PDFs, for use outside of Perlego. However, you can download books within the Perlego app for offline reading on mobile or tablet. Learn how to download books offline
Perlego offers two plans: Essential and Complete
Essential is ideal for learners and professionals who enjoy exploring a wide range of subjects. Access the Essential Library with 800,000+ trusted titles and best-sellers across business, personal growth, and the humanities. Includes unlimited reading time and Standard Read Aloud voice.
Complete: Perfect for advanced learners and researchers needing full, unrestricted access. Unlock 1.4M+ books across hundreds of subjects, including academic and specialized titles. The Complete Plan also includes advanced features like Premium Read Aloud and Research Assistant.
Both plans are available with monthly, semester, or annual billing cycles.
We are an online textbook subscription service, where you can get access to an entire online library for less than the price of a single book per month. With over 1 million books across 990+ topics, we’ve got you covered! Learn about our mission
Look out for the read-aloud symbol on your next book to see if you can listen to it. The read-aloud tool reads text aloud for you, highlighting the text as it is being read. You can pause it, speed it up and slow it down. Learn more about Read Aloud
Yes! You can use the Perlego app on both iOS and Android devices to read anytime, anywhere — even offline. Perfect for commutes or when you’re on the go. Please note we cannot support devices running on iOS 13 and Android 7 or earlier. Learn more about using the app
Yes, you can access Practical Three-Way Calibration by Alejandro Olivieri,Graciela M. Escandar in PDF and/or ePUB format, as well as other popular books in Physical Sciences & Analytic Chemistry. We have over one million books available in our catalogue for you to explore.