- 352 pages
- English
- ePUB (mobile friendly)
- Available on iOS & Android
eBook - ePub
About this book
Offshore Safety Management, Second Edition provides an experienced engineer's perspective on the new Safety and Environmental System (SEMS) regulations for offshore oil and gas drilling, how they compare to prior regulations, and how to implement the new standards seamlessly and efficiently. The second edition is greatly expanded, with increased coverage of technical areas such as engineering standards and drilling, and procedural areas such as safety cases and formal safety assessments. The new material both complements the SEMS coverage and increases the book's relevance to a global audience.Following the explosion, fire, and sinking of the Deepwater Horizon floating drilling rig in April 2010, the Bureau of Ocean Energy Management, Regulations, and Enforcement (BOEMRE) issued many new regulations. One of them was the Safety and Environmental System rule, which is based on the American Petroleum Institute's SEMP recommended practice, finalized in April 2013.Author Ian Sutton explains the SEMS rule, and describes what must be done to achieve compliance. Each of the twelve elements of the SEMS rule (such as Management of Change and Safe Work Practices) is described in the book, and guidance is provided on how to meet BOEMRE requirements.- Detailed explanation of how to implement the new SEMS standard for offshore operations- Ties the new regulations in with existing safety management approaches, helping managers leverage existing processes and paperwork- With CEOs now signing off on compliance paperwork, this book provides expert insights so you can get SEMS compliance right the first time
Tools to learn more effectively

Saving Books

Keyword Search

Annotating Text

Listen to it instead
Information
Chapter 1
Risk Management
This chapter describes the principles of risk management as they apply to the offshore oil and gas industry, the impact the Deepwater Horizon/Macondo event had on the industry and how safety management systems have evolved in response. The fundamentals of safety management are described including: acceptable risk, process safety and culture, the use of risk matrices, the economics of offshore safety, means of measuring progress, and leading and lagging indicators. The distinction between prescriptive and nonprescriptive systems is discussed.
Keywords
Safety management systems; Deepwater Horizon; Macondo; risk management; acceptable risk; ALARP; leading and lagging indicators; economics of safety
Chapter Contents
Introduction
Impact of Deepwater Horizon/Macondo
Process safety trends
Offshore
The pipeline industry
Safety management systems
Organization of this book
Historical background
Onshore developments
Occupational safety, process safety, and culture
Occupational safety
Process safety
The Baker Report
The incident triangle
Risk management
Perception of the consequence term
Performance-based/prescriptive programs
Nonprescriptive
Performance-based
Fiberglass composite pipe example
Acceptable risk
Uncertainty
Cost-benefit analysis
Risk reduction
As low as reasonably practicable risk—ALARP
Setting ALARP
Difficulties with ALARP
Reverse ALARP
Risk matrices
Consequence matrix
Frequency matrix
Risk matrix
Safety management systems
Fundamentals
Safe limits
Holistic
Involvement and thoroughness
Operators
Elements of an SMS
1. Facility description
2. Technical information
3. Risk assessment
4. Risk acceptance
5. Report
6. Audit
Economics
Benefits
Costs
BOEMRE data
Measuring progress
Lagging and leading indicators
Lagging indicators
Leading indicators
Key performance indicators
Tier 1—Process safety event
Tier 2—Process safety event
Tier 3—Challenge to safety systems
Tier 4—Operating discipline and management system performance
Safety as a causal factor
Culture
References
Introduction
The offshore oil and gas business is hazardous. Some of the many issues to be concerned about include the following:
• Explosions and fires.
• Weather conditions can be harsh and unforgiving.
• Toxic gases, particularly hydrogen sulfide (H2S), are a frequent by-product of the oil and gas that is produced.
• Emergency response can be a challenge; platforms and rigs are small and congested. And the people on board have to respond with the resources they have; outside help is not usually quickly available.
Thus, from its very beginning this industry has had to pay particular attention to the safety of the workers and the prevention of catastrophic events. Generally these efforts have been successful, particularly with regard to occupational or personal safety, as illustrated in Figure 1.1, which shows the progress that has been made in recent years in the United States (mostly the Gulf of Mexico).
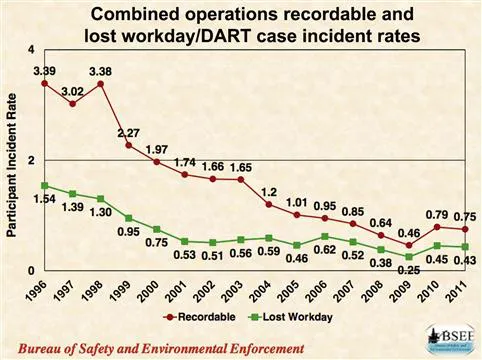
Figure 1.1 Safety trends—United States Outer Continental Shelf. (Source: United States Mineral Management Service, 2009)
Figure 1.1 was first published by the United States Mineral Management Service (MMS)—the government agency responsible, at the time, for offshore safety regulation and enforcement. These responsibilities for the MMS are now handled by the Bureau of Safety and Environmental Enforcement—BSEE. The chart provides data to do with the number of offshore safety incidents for the period 1996 to 2011. The trend is impressive: in just 12 years the recordable injury rate declined from 3.39 to 0.75, a drop of around 80 percent. And the number of lost workdays dropped by a similar percentage. Moreover the trend is quite smooth and steady, showing that the results are not a fluke or one-time event. And these advances were made as the industry has worked in ever-more challenging conditions—particularly as it has moved into very deep water operations.
Figure 1.2 shows a similar positive trend with respect to the industry’s environmental record. The data, which are provided by the United States Coast Guard, include some land-based facilities, and also spills from inshore (state) waters. If the two bars for each of the years in Figure 1.2 are combined, it can be seen that the amount of oil spilled annually has declined from just under 6 million gallons in the early 1980s to an almost negligible amount by the year 2005.
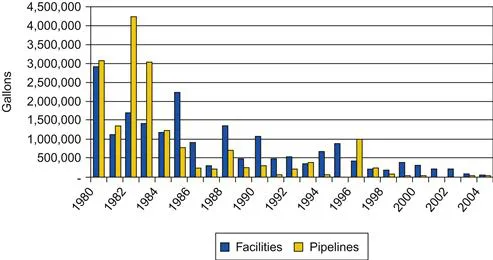
Figure 1.2 Environmental trends—Offshore United States.
Impact of Deepwater Horizon/Macondo
The trends shown in Figures 1.1 and 1.2 are largely attributable to improvement in occupational or personal safety. And prior to the year 2010, the trends to do with major events such as fires and blowouts also seemed to be favorable, although the level of improvement was not as great for personal safety and the quality of the data was not nearly as good.
Then came the Deepwater Horizon explosion and fire followed by the spill of oil from the Macondo well.
To say that this catastrophe was a shock to the industry would be a gross understatement. Not only was the initial impact of the loss of life, the destruction of the rig, and the massive spill dramatic enough, but the event showed that systems were not in place to respond promptly to a catastrophe of this magnitude. In particular, it took 5 months before the well could be sealed; and during those 5 months, dramatic scenes were broadcast around the world showing oil pouring into the ocean 1 mile down. Equally compelling footage of events onshore, such as the death of wild birds and the closure of many small businesses, added to the impression of a situation out of control. In other words, the Deepwater Horizon event had public relations implications that went way beyond the losses associated with just one drilling rig. As the National Commission Report (2011) described on page 75 to President Obama said:
Deepwater energy exploration and production, particularly at the frontiers of experience, involve risks for which neither industry nor government has been adequately prepared, but for which they can and must be prepared in the future.
Moreover, the event revealed structural flaws in the safety management systems of offshore facilities.
The discussion concerning Titanic disaster in Chapter 2 provides the following quotation (Brander 1995):
The Titanic disaster suddenly ripped away the blindfolds and changed dozens of attitudes, practices, and standards almost literally overnight.
The same comment could be applied to the Deepwater Horizon catastrophe.
At the time of writing, the consequences raised by Deepwater Horizon are not confined to the offshore oil and gas industry. At the time of this writing, the consequences of the severe damage to the Fukushima nuclear power plants in Japan are still being ascertained. But it is clear that those consequences will be profound; substantial quantities of radioactive materials have been released, a significant fraction of Japan’s power-generating capability is lost forever, and the cost of clean-up and remediation is going to be enormous. Indeed, the Fukushima accident may result in a massive slowdown in the construction of new nuclear power plants worldwide. Clearly, the offshore oil and gas industry is not the only one facing major challenges with respect to the management of safety and environmental performance.
Process safety trends
Figure 1.1 shows the impressive improvements that have occurred in occupational safety over the last two decades. It is difficult to develop com...
Table of contents
- Cover image
- Title page
- Table of Contents
- Copyright
- Preface
- Warning—Disclaimer
- Chapter 1. Risk Management
- Chapter 2. Major Offshore Events
- Chapter 3. Safety Offshore
- Chapter 4. Regulations and Standards
- Chapter 5. Safety and Environmental Management Systems
- Chapter 6. Contractors
- Chapter 7. Implementing SEMS
- Chapter 8. Safety Cases
- Chapter 9. Formal Safety Analysis
- Bibliography
- Index
Frequently asked questions
Yes, you can cancel anytime from the Subscription tab in your account settings on the Perlego website. Your subscription will stay active until the end of your current billing period. Learn how to cancel your subscription
No, books cannot be downloaded as external files, such as PDFs, for use outside of Perlego. However, you can download books within the Perlego app for offline reading on mobile or tablet. Learn how to download books offline
Perlego offers two plans: Essential and Complete
- Essential is ideal for learners and professionals who enjoy exploring a wide range of subjects. Access the Essential Library with 800,000+ trusted titles and best-sellers across business, personal growth, and the humanities. Includes unlimited reading time and Standard Read Aloud voice.
- Complete: Perfect for advanced learners and researchers needing full, unrestricted access. Unlock 1.4M+ books across hundreds of subjects, including academic and specialized titles. The Complete Plan also includes advanced features like Premium Read Aloud and Research Assistant.
We are an online textbook subscription service, where you can get access to an entire online library for less than the price of a single book per month. With over 1 million books across 990+ topics, we’ve got you covered! Learn about our mission
Look out for the read-aloud symbol on your next book to see if you can listen to it. The read-aloud tool reads text aloud for you, highlighting the text as it is being read. You can pause it, speed it up and slow it down. Learn more about Read Aloud
Yes! You can use the Perlego app on both iOS and Android devices to read anytime, anywhere — even offline. Perfect for commutes or when you’re on the go.
Please note we cannot support devices running on iOS 13 and Android 7 or earlier. Learn more about using the app
Please note we cannot support devices running on iOS 13 and Android 7 or earlier. Learn more about using the app
Yes, you can access Offshore Safety Management by Ian Sutton in PDF and/or ePUB format, as well as other popular books in Technology & Engineering & Public Health, Administration & Care. We have over one million books available in our catalogue for you to explore.