
eBook - ePub
Human Growth and Development
- 600 pages
- English
- ePUB (mobile friendly)
- Available on iOS & Android
eBook - ePub
Human Growth and Development
About this book
Offering a study of biological, biomedical and biocultural approaches, the second edition of Human Growth and Development is a valued resource for researchers, professors and graduate students across the interdisciplinary area of human development. With timely chapters on obesity, diet / lifestyle, and genetics, this edition is the only publication offering a biological, biomedical and biocultural approach. The second edition of Human Growth and Development includes contributions from the well-known experts in the field and is the most reputable, comprehensive resource available.
- New chapters discussing genomics and epigenetics, developmental origins, body proportions and health and the brain and neurological development
- Presented in the form of lectures to facilitate student programming
- Updated content highlighting the latest research on the relationship between early growth and later (adult) outcomes: the developmental origins of health and disease
Tools to learn more effectively

Saving Books

Keyword Search

Annotating Text

Listen to it instead
Information
Chapter 1
The Human Growth Curve, Canalization and Catch-Up Growth
Centre for Global Health and Human Development, School of Sport, Exercise and Health Sciences, Loughborough University, Leicestershire LE11 3TU, UK
Content
1.1 Introduction
1.2 Historical Background
1.3 The Distance Curve of Growth
1.4 The Velocity Growth Curve and Growth Spurts
1.5 Other Patterns of Growth
1.6 Growth Versus Maturity
1.7 The Control of Growth
1.8 Growth Reference Charts
1.9 Canalization
1.10 Catch-Up Growth
1.11 Summary and Conclusions
References
Suggested Reading
Internet Resources
1.1 Introduction
Human growth and development are characterized and defined by the way in which we change in size, shape and maturity relative to the passage of time. In order to understand this biological process it is fundamentally important to understand the terminology used to describe the process and the way in which it is measured and assessed. It is also important to appreciate the historical context within which the study of human growth and development has its roots.
1.2 Historical Background
This introduction to the curve of human growth and development begins in the “age of Enlightenment” in eighteenth century France. Between the death of Louis XIV in 1715 and the coup d’état of 9 November 1799 that brought Napoleon Bonaparte to power, philosophy, science and art were dominated by a movement away from monarchial authority and dogma and towards a more liberal and empirical attitude.1 Its philosophers and scientists believed that people’s habits of thinking were based on irrationality, polluted by religious dogma, superstition, and overadherence to historical precedent and irrelevant tradition. The way to escape from this, to move forward, was to seek for true knowledge in every sphere of life, to establish the truth and build on it. People’s minds were, literally, to be “enlightened”.2 Its prime impulse was in pre-Revolutionary France within a group of mostly aristocratic and bourgeois natural scientists and philosophers that included Rousseau, Voltaire, Diderot and Georges Louis LeClerc, the Compte de Buffon (Figure 1.1). Their contributions to Diderot’s Encyclopedia – the first literary monument to the Enlightenment – earned them the collective title of “the Encyclopedists”.
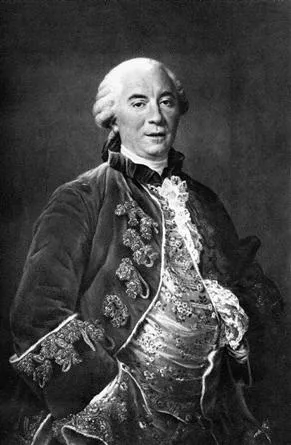
Figure 1.1 Georges-Louis Leclerc, Compte de Buffon (1707–1788).
Buffon was born on 7 September 1707 at Montbard in Bourgogne, in central France. His father, Benjamin-Francois Leclerc, described by the biographer Franck Bourdier as “un homme sans grand charactère”, was a minor parliamentary official in Burgundy and was married to an older woman, Anne-Christine Marlin.3 In 1717 Anne-Christine inherited a considerable fortune from an extremely wealthy uncle, Georges Blaisot, which allowed Monsieur Leclerc to buy the land of Buffon and the “châtellenie” of Montbard. Georges Louis was educated by the Jesuits at the Colleges de Godran, where he demonstrated an aptitude for mathematics. In 1728 he moved to the University of Angers and thence suddenly to England following a duel with an officer of the Royal-Croates over “une intrigue d’amour”. He traveled in Switzerland, France and Italy during the next four years, returning to Dijon on the death of his mother in 1732. Much against his father’s wishes he inherited his mother’s estate at Montbard and from then on divided his time between Paris and the country pursuing his interests in mathematics, natural science and silviculture. By the age of 32 he was recognized as the premier horticulturist and arborist in France and was appointed by King Louis XV as the director of the Jardin du Roi in 1739. This position was the equivalent of being the chief curator of the Smithsonian, or the British Museum of Natural History – it was the most prestigious governmental scientific position in the “natural sciences” that Buffon could have obtained. During the next few years Buffon started to work on an immense project that was to include all that was known of natural history. Histoire Naturelle, Générale et Particulière would be a vast undertaking but one that Buffon, who from all accounts was a man of no small ego, appeared to relish and which by his death in 1788 was composed of 36 volumes. There were 15 volumes on quadrupeds (1749–1767), nine on birds (1770–1783), five on minerals (1783–1788) and seven supplementary volumes. Eight further volumes prepared by E. de Lacepede were added posthumously between 1788 and 1804 and included two volumes on reptiles (1788–1789), five on fish (1798–1803) and one on Cetacea (1804). However, it is the supplement to Volume 14, published in 1778, that is of particular interest.
Within this supplement on page 77 there is the record of the growth of a boy known simply as “De Montbeillard’s son”. The friendship between Philibert Geuneau De Montbeillard (1720–1785) and Buffon had been secured by a common interest in the natural sciences. Buffon had been working closely for many years with his younger neighbor from Montard, Louis-Jean-Marie Daubenton (1716–1799), whose statue now adorns the Parc Buffon in Montard (while Buffon’s statue is to be found in the Jardin des Plantes in Paris). Daubenton had graduated in Medicine at Reims in 1741 and returned to Montard to set up practice as a physician. This coincided with Buffon’s initial preparations for the first volumes of Histoire Naturelle and in 1742 he invited Daubenton to provide a series of anatomical descriptions of animals. Daubenton’s subsequent descriptions of 182 species of quadruped that appeared in the early volumes of Histoire Naturelle established him as the foremost comparative anatomist of his day. However, De Montbeillard was to replace Daubenton in Buffon’s affections and between 1770 and 1783 De Montbeillard coauthored the nine volumes of Histoire Naturelle devoted to birds. He was also a correspondent of Diderot and clearly recognized as one of the Encyclopedists. Given the desire of these central scientific figures of the Enlightenment to measure and describe the natural world it is not too surprising that De Montbeillard would take an empirical interest in the growth of his own son. Nor is it inconceivable that his friend and colleague Buffon would wish to include this primary evidence of the course of human growth within his opus magnum.
De Montbeillard had been measuring the height of his son about every 6 months from his birth in 1759 until he was 18 years of age in 1777. The boy’s measurements of height were reported in the French units of the time – pieds, pouces and lignes – which correspond roughly to present-day units as a foot, an inch and the 12th part of an inch. (Tanner,4 p. 470, notes that, “The Parisian pied, or foot, divided into 12 pouces, or inches, each divided into 12 lignes, was longer than the English foot. Isaac Newton … found 1 pied equal to 12.785 inches, but the later official conversion, on the introduction of the metre, gave it as 12.7789 inches. The pouce, then, equals 2.71 cm whereas the English inch equals 2.54 cm”.)
Richard E. Scammon (1883–1952), of the Department of Anatomy and the Institute of Child Welfare at the University of Minnesota, translated these measurements into centimeters and published his results in 1930 in the American Journal of Physical Anthropology under the title of “The first seriatim study of human growth” and thus for the first time we were able to look upon the growth of De Montbeillard’s son in the form of a chart.5
1.3 The Distance Curve of Growth
By joining together the data points at each age, Scammon produced a curve that described the height achieved at any age that became known as a “height distance” or “height-for-age” curve (Figure 1.2). The term “distance” is used to describe height achieved because it is easy to visualize and understand the fact that a child’s height at any particular age is a reflection of how far that child has progressed towards adulthood. It embodies the sense of an ongoing journey that we are, as it were, interrupting to take a “snapshot” at a particular moment in time. The resulting curve is interesting for a number of reasons. First, when growth is measured at intervals of 6 months or a year, the resultant curve is a relatively smooth and continuous process; it is not characterized by periods of no growth and then by dramatic increases in stature. Second, growth is not a linear process; we do not gain the same amount of height during each calendar year. Third, the curve of growth has four distinct phases (or perhaps five if the mid-growth spurt is included; see below) corresponding to relatively rapid growth in infancy, steady growth in childhood, rapid growth during adolescence and very slow growth as the individual approaches adulthood. Fourth, growth represents a most dramatic increase in size; De Montbeillard’s son, for instance, grew from about 60 cm at birth to over 180 cm at adulthood. The majority of that growth (more than 80%) occurs during infancy and childhood, but perhaps the most important physical changes occur during adolescence. Fifth, humans cease growing, or reach adult heights, during the late teenage years at 18 or 19 years of age.
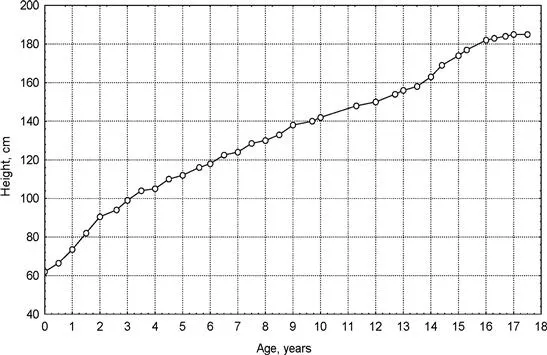
Figure 1.2 The growth of De Montbeillard’s son 1759–1777: distance.
Source: Tanner.6
The pattern of growth that can be seen from this curve is a function of the frequency of data acquisition. For instance, if we were to measure a child only at birth and at 18 years we might believe, by joining up these two data points, that growth was a linear process. Clearly, the more frequently we collect data the more we can understand about the actual pattern of growth on a yearly, monthly, weekly or even daily basis. Naturally, such high-frequency studies are logistically very difficult and thus there are only a very few in existence. Perhaps the most important are those of Dr Michele Lampl, who was able to assess growth in length, weight and head circumference on a sample of 31 children on daily, twice-weekly and weekly measurement frequencies.7 The resulting data demonstrated that growth in height may not be a continuous phenomenon but may actually occur in short bursts of activity (saltation) that punctuate periods of no growth (stasis) (see Chapter 16). However, the data for De Montbeillard’s son were collected approximately 6-monthly and thus at best they can only provide information about the pattern of growth based on a half-yearly or yearly measurement frequency.
It is clear that the pattern of growth that results from these 6-monthly measurements is in fact composed of several different curves. During “infancy”, between birth and about 5 years of age, there is a smooth curve that can be described as a “decaying polynomial” because it gradually departs negatively from a straight line as time increases. During childhood, between 5 and about 10 years of age, the pattern does not depart dramatically from a straight line. This pattern changes during adolescence, between about 10 and 18 years of age, into an S-shaped or sigmoid curve reaching an asymptote at about 19 years of age.
The fact that the total distance curve may be represented by several mathematical functions allows mathematical “models” to be applied to the pattern of growth. These models are, in fact, parametric functions that contain constants or “parameters”. Once an appropriate function that fits the raw data has been found the parameters can be analyzed, revealing a good deal about the process of human growth (see Chapter 3). For instance, in the simplest case of two variables such as age (x) and height (y) being linearly related between, say, 5 ...
Table of contents
- Cover image
- Title page
- Table of Contents
- Dedication
- Copyright
- Contributors
- Introduction
- Chapter 1. The Human Growth Curve, Canalization and Catch-Up Growth
- Chapter 2. Growth in Infancy and Childhood: A Pediatric Approach
- Chapter 3. Adolescent Growth
- Chapter 4. Puberty
- Chapter 5. Endocrine Control of Growth
- Chapter 6. Nutrition and Growth
- Chapter 7. Genomics, Epigenetics and Growth
- Chapter 8. The Genetic Epidemiology of Growth and Development
- Chapter 9. Social and Economic Effects on Growth
- Chapter 10. Environmental Effects on Growth
- Chapter 11. The Evolution of Human Growth
- Chapter 12. Early Environments, Developmental Plasticity and Chronic Degenerative Disease
- Chapter 13. Leg Length, Body Proportion, Health and Beauty
- Chapter 14. Physical Activity as a Factor in Growth and Maturation
- Chapter 15. Comparative and Evolutionary Perspectives on Human Brain Growth
- Chapter 16. Saltation and Stasis
- Chapter 17. Lectures on Human Growth
- Chapter 18. Body Composition During Growth and Development
- Chapter 19. The Measurement of Human Growth
- Chapter 20. Assessment of Maturation
- Chapter 21. Growth References and Standards
- Color Plates
- Index
Frequently asked questions
Yes, you can cancel anytime from the Subscription tab in your account settings on the Perlego website. Your subscription will stay active until the end of your current billing period. Learn how to cancel your subscription
No, books cannot be downloaded as external files, such as PDFs, for use outside of Perlego. However, you can download books within the Perlego app for offline reading on mobile or tablet. Learn how to download books offline
Perlego offers two plans: Essential and Complete
- Essential is ideal for learners and professionals who enjoy exploring a wide range of subjects. Access the Essential Library with 800,000+ trusted titles and best-sellers across business, personal growth, and the humanities. Includes unlimited reading time and Standard Read Aloud voice.
- Complete: Perfect for advanced learners and researchers needing full, unrestricted access. Unlock 1.4M+ books across hundreds of subjects, including academic and specialized titles. The Complete Plan also includes advanced features like Premium Read Aloud and Research Assistant.
We are an online textbook subscription service, where you can get access to an entire online library for less than the price of a single book per month. With over 1 million books across 990+ topics, we’ve got you covered! Learn about our mission
Look out for the read-aloud symbol on your next book to see if you can listen to it. The read-aloud tool reads text aloud for you, highlighting the text as it is being read. You can pause it, speed it up and slow it down. Learn more about Read Aloud
Yes! You can use the Perlego app on both iOS and Android devices to read anytime, anywhere — even offline. Perfect for commutes or when you’re on the go.
Please note we cannot support devices running on iOS 13 and Android 7 or earlier. Learn more about using the app
Please note we cannot support devices running on iOS 13 and Android 7 or earlier. Learn more about using the app
Yes, you can access Human Growth and Development by Noel Cameron,Lawrence Schell,Noel Professor Cameron,Barry Bogin in PDF and/or ePUB format, as well as other popular books in Scienze biologiche & Biologia. We have over one million books available in our catalogue for you to explore.