![]()
Chapter One
Site Evaluation
Examining the Proposed Site to Ensure That It Has Adequate Wind and Space
Abstract
Selecting a proper location for your wind energy system is probably more important than deciding which system to purchase, because a well-designed wind machine doesn’t operate at its performance capabilities if it has poor wind conditions. Many wind energy systems have not been successful economically because of poor site selection. The site selection process not only involves the physical location for best wind and safety concerns, but it involves placing the wind turbine at the proper height for reduced turbulence and good wind. Site selection begins with determining the wind speed at the desired location and then involves considering safety issues and noise considerations.
Keywords
wind map; annual energy production; Rayleigh distribution; wind speed histogram; anemometer; tower height; wind flow around and over buildings; setback; safety; noise
Selecting a proper location for your wind energy system is probably more important than deciding which wind system to purchase because a well-designed wind machine doesn’t operate at its performance capabilities if it has poor wind conditions. Many wind energy systems have not been successful economically because of poor site selection. The site selection process not only involves the physical location for best wind and safety concerns, but involves placing the wind turbine at the proper height for reduced turbulence and good wind. Site selection begins with determining the wind speed at the desired location and then involves considering safety issues and noise considerations.
Determining the wind speed at a proposed wind turbine site is critical to estimating the economic potential of the wind turbine. The preferred way is to measure the wind speed with accurate wind-recording equipment. However, this is often cost-prohibitive for small wind systems because of the relative cost of the measuring equipment to the actual cost of the wind-generating system. Typically, you do not want to spend more than about 5% of the cost of the wind system in determining the wind speed at a proposed site. A basic wind-recording system, which includes tower, anemometers, and data logger, is about $7,500.00 [1]; therefore, the estimated cost of the wind system would need to be above $150,000 before you wanted to spend the money to do actual wind measurements. However, if the proposed system is for a public project such as a school or government building, it might need to have a wind measurement program to provide a more accurate estimate of the performance.
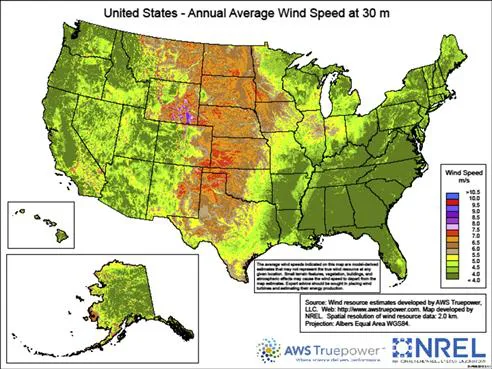
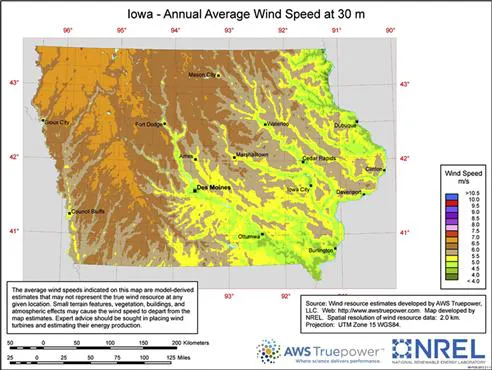
There are several other ways of estimating the wind at any potential wind turbine location in addition to making actual measurements. The U.S. Department of Energy (DOE) published their first wind energy atlas in 1986. The staff at the National Renewable Energy Laboratory has continued to upgrade these wind data into wind energy maps and has made them available at the DOE-sponsored Wind Powering America web site [2]. The web site address is www.windpoweringamerica.gov/windmaps. The site contains wind maps for utility-scale wind systems with maps at 80 m height for land based systems and 90 m height for offshore systems. The maps for community-scale wind systems are at a height of 50 m. These maps should be used for mid-size turbines as well. The last set of maps are for residential-scale systems or small wind systems and are at a height of 30 m. Figure 1.1 is the U.S. map showing the wind speeds at 30m. You can access individual state maps by clicking on the state that you are interested in and the state map will appear. There is a download icon so that the map can be downloaded to your computer. Figure 1.2 is a map for the state of Iowa. The state maps show more detail and it is easier to locate the specific area or areas of interest. Once the maps are downloaded, you can zoom in to have a closer look at areas of interest as well. These maps are continually being updated by the staff at the National Renewable Energy Laboratory, so these should provide a good estimate of the wind speed at any location. Wind maps are available for many countries throughout the world. The National Renewable Energy Laboratory web site has wind maps available for about 30 countries. The Riso National Laboratory in Denmark also maintains wind maps for almost all of Europe and several different countries. These wind maps give either average wind speeds or wind power densities for many regions. Because worldwide maps are available at various heights, you need to be sure to note the height of the wind resource information obtained. Wind speed varies with height and will need to be corrected to the proposed height of your wind system.
Figure 1.1 Wind resources map of the United States for a height of 30 meters (National Renewable Energy Laboratory, 2012).
Figure 1.2 Wind resources map of Iowa for a height of 30 meters (National Renewable Energy Laboratory, 2012).
You may also obtain an average wind speed from some nearby source such as a weather station, airport, or any number of agencies or businesses that collect local weather. If you obtain local wind data be sure to ask at what height data were collected because you will probably need to correct it for height. The change in wind speed with height is called wind shear. It has been measured in all types of weather conditions and can be either increasing as height is increased or it can, under certain weather conditions, decrease with height. Wind shear can be calculated by using a power law function
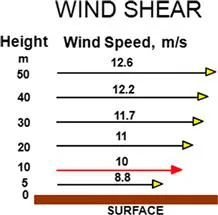
where v is the new wind speed at height H, vo is the measured wind speed at height Ho, and α is the wind shear exponent. Under what is called stable conditions, where air temperature decreases with height, the wind shear exponent will normally be 1/7 or 0.14. The wind shear exponent will vary depending on atmospheric conditions and on the terrain or roughness of the ground. One thing to consider in determining wind shear near homes and businesses is that as landscaping grows over the years, the wind shear will usually increase and the wind speed will be reduced at the hub height of the wind turbine. Many measurements of wind shear made between 10 and 40 meters show that the power function is nearer 0.20 than the usually assumed 1/7 or 0.14 [3]. Although the effect of wind shear on wind speed seems slight, one must remember that since wind power is a function of the wind speed cubed, small changes in wind speed can affect wind power greatly. Figure 1.3 shows changes in wind speed as height increases beginning with a wind speed of 10 m/s at a height of 10 meters. The wind speed at 50 meters is 12.6 m/s, which produces approximately twice the power as a wind speed of 10 m/s, which occurs at a 10-meter height. Care must be taken in using wind data collected at many weather stations, normally at a 10-meter height, and using the wind shear component to estimate wind speeds at 30- and 40-meter heights because conditions vary so much that the wind shear exponent may not be that representative of the location. This is why it is always best to measure the wind speed at the site and at the height of the proposed wind turbine.
Figure 1.3 Changes in wind speed at various heights above the same surface showing effects of wind shear on wind speed.
Calculating Wind Speed Distribution from Average Wind Speed
If one knows the average wind speed for a location and has corrected it to the desired height, then a wind speed distribution can be calculated using either Weibull or Rayleigh distribution. Rayleigh distribution is a special case of Weibull distribution and is used for most land-based wind turbine sites. The International Small Wind Turbine Standard IEC 61400-2 [4] recommends use of the Rayleigh distribution which is given as
where f(v) is the frequency of occurrence associated with each wind speed, v; which is at the center of Δv; Δv is the class or wind speed bin; and va is the average or mean wind speed. The wind speed histogram can be calculated for one year by 8,760 times F(v). The wind speed histogram for a month can be calculated using F(v) for the month times the hours in the selected month.
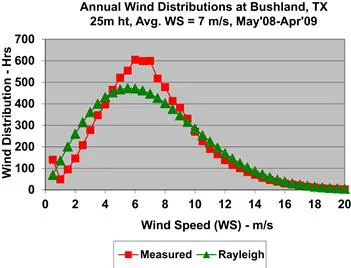
Figure 1.4 shows an annual wind speed histogram calculated from the Rayleigh distribution formula compared to a measured annual histogram at Bushland, Texas. The average wind speed for this height and years was 7.0 m/s. Note that the actual histogram has some humps and valleys compared to the smooth curves of the Rayleigh histogram. This will always be the case when comparing a calculated histogram to a measured histogram. Also note that the peak is slightly different and not as sharp. Generally, Rayleigh distribution is a good approximation of the actual histogram. Before calculating a wind speed histogram using Rayleigh distribution, be sure to correct the average wind speed for height. It is much easier to correct average wind speed than trying to adjust wind speed bins and hours.
Figure 1.4 Actual measured wind speed distribution and calculated Rayleigh wind speed distribution for Bushland, Texas. Data collected at a 25-meter height in 2008 and 2009.
Measuring Wind Speed at Potential Wind Turbine Site
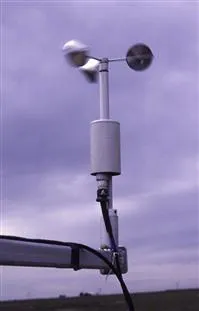
The most desired method to determine wind speed at a potential wind turbine site is to measure the wind speed at the proposed site and height. A typical wind-measuring system includes the following basic equipment: anemometer, wind vane, data logger, tower, and associated wiring. If possible, a temperature sensor and barometric pressure sensor add important data to allow for air density calculations. This is especially important if the elevation is greater than about 300 meters. Both cup- and propeller-type anemometers are used for wind resource measurements. Cup-type anemometers (Figure 1.5) normally employ a pulse-counting type of signal that can be transmitted easily over several meters with very little loss of signal. This makes the cup anemometer more useful for wind power measurements than the propeller type because direct current (DC) generator outputs cannot be transmitted over very long distances before the signal is diminished. Sonic-type anemometers have been used some in recent years, but are plagued by suspended particles in the air stream. Dust, snow, and other objects transported in the wind give unusually high wind speeds. If the wind is to be measured in areas that experience icing, then a heated anemometer is needed to measure the wind speed accurately at all times. It is usually not worth the added expense if icing only occurs for one or two days per year.
Figure 1.5 Cup anemometer used to measure wind speed.
Wind direction is not used to determine potential wind generation, but is im...