The purpose of this book is to teach nurses and other allied health professionals how to easily and confidently interpret 12-lead electrocardiograms using the principles of pattern recognition. We begin with some basic principles and then move on to more specific clinical topics. Areas covered include right and left bundle branch block as well as the fascicular blocks. A fast and easy way to determine axis deviation is presented. Other topics include chamber enlargement and
- 144 pages
- English
- ePUB (mobile friendly)
- Available on iOS & Android
eBook - ePub
The 12-Lead Electrocardiogram for Nurses and Allied Professionals
About this book
Trusted by 375,005 students
Access to over 1.5 million titles for a fair monthly price.
Study more efficiently using our study tools.
Information
Topic
MedicineChapter 1
Basic Anatomy and Physiology
Before we begin to look at specific patterns needed to interpret ECGs, we are going to need to establish a common frame of reference; the electrical system of the heart.
If you look at an actual specimen of the heart, it seems as though the whole heart is all connected together. However, from an electrical standpoint, the upper chambers, called atria, are separated from the lower chambers, called ventricles. The separation occurs at the four valve annuli, which all lie in the same plane separating the atria from the ventricles. Electrical impulses can only pass from the atria to the ventricles through the normal conduction system, which occurs at one location in the floor of the right atrium.
The normal electrical impulse originates in the sinus node or SA node, which is located in the right atrium (see figure 1).The node is located on the epicardial surface or the outside of the heart near the junction of the right atrial appendage and the superior vena cava. The sinus node is considered the normal “pacemaker” of the heart because it has the property of intrinsic automaticity. This means that the sinus node can generate electrical impulses all by itself. Once the sinus node generates an impulse, it spreads out to first activate the right atrium and then the left atrium. Atrial activation produces the P wave on the ECG (see figure 2). Once the atria are activated, the impulse needs to travel to the lower chambers or ventricles. This occurs by way of the native conduction system. This begins at the AV node (see figure 1), located in the floor of the right atrium. The AV node has the unique property referred to as “decremental conduction.” This means that the faster you engage it, the slower it conducts. This has a very important implication in our overall survival. It prevents atrial arrhythmias, such as atrial fibrillation or atrial flutter from conducting rapidly to the ventricles which would result in fatal ventricular arrhythmias. This is an important function since atrial arrhythmias are quite common.
The impulse in the AV node is delayed permitting time for the atria to contract before the ventricles. This results in filling of the ventricles with blood. You would not want the atria and ventricles to contract at the same time, as this would result in blood flowing backward in the atria as they would be contracting against closed AV valves. This would significantly compromise ventricular filling and hence, cardiac output.
The atrial activation plus the AV nodal delay produces the PR interval on the electrocardiogram. The PR interval is defined as the time from the onset of the P wave to the onset of the QRS complex (see figure 2).
Once the AV delay is complete, the impulse then spreads rapidly to activate both ventricles. The impulse starts at the His bundle (see figure 1). This is named after Wilhelm His, a Swiss-born German cardiologist from the late 1800s and does not have any gender implication (His bundle as opposed to Her bundle).
The impulse travels through the His bundle which then divides into the right and left bundle branches going to each corresponding ventricle. The left bundle further splits into a left anterior fascicle and a left posterior fascicle (see figure 1). The fibers ultimately terminate in the Purkinje network, which then activates the heart muscle. Conduction through the His Purkinje system is very rapid.
The ECG manifestation of ventricular activation produced by the His Purkinje system is the QRS complex. Ventricular repolarization or recovery is represented by the T wave on the ECG. Both ventricles are activated simultaneously, as opposed to sequentially, producing a narrow QRS (see figure 2).
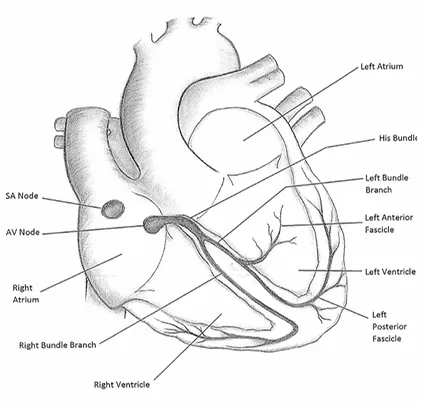
Figure 1. The Heart’s Electrical System
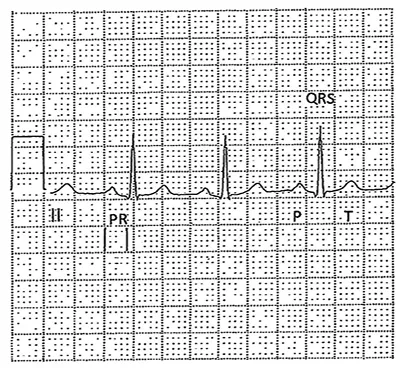
Figure 2. Normal ECG Complexes
Chapter 2
Basic Features of the ECG and Heart Rate
In this chapter, we are going to begin looking at the 12-lead ECG. The leads are divided into two broad groups, designated as limb leads and precordial leads.
The limb leads are I, II, III, aVR, aVL, and aVF. These six leads look at activity in the frontal plane of the heart (see figure 1).
Subsets of the limb leads include several groupings. Leads II, III, and aVF represent a set referred to as the “inferior” leads. Leads I and aVL represent a set referred to as the “lateral” leads.
The precordial leads are V1 through V6. These leads look at activity in the horizontal plane of the heart (see figure 1).
Now let us examine the actual ECG paper (see figure 1). Looking at the paper from left to right on the horizontal axis we will be measuring time. Each big box is made up of five small boxes. Each big box represents a time interval of 0.2 seconds or 200 milliseconds. Each small box defines an interval of 0.04 seconds or 40 milliseconds. Five big boxes added together, 0.2 x 5, equals 1 second of time. In summary, the horizontal axis measures time on the 12-lead electrocardiogram.
Looking in the up and down direction on the vertical axis, we will now be measuring voltage. The ECG is calibrated in such a way that distance or length can be converted to voltage. On a standard ECG, 10 millimeters of distance or two big boxes in the vertical direction correlates with 1 millivolt of voltage (see figure 1). In general, the taller a complex, the more voltage it has. This is significant when looking at increased voltages such as that seen with left ventricular hypertrophy.
Heart Rate
The first thing that we will do is measure the heart rate. The rhythm must be fairly regular in order to calculate the rate. You will need a pair of calipers and a calculator for this task.
The heart rate is equal to 300 divided by the number of big boxes which are contained in the R-R interval between any two QRS complexes.
Remember, each big box is made up of five small boxes. Therefore, each small box represents 0.2 portions of a b...
Table of contents
- Preface
- Acknowledgments
- Chapter 1
- Chapter 2
- Chapter 3
- Chapter 4
- Chapter 5
- Chapter 6
- Chapter 7
- Chapter 8
- Chapter 9
- Chapter 10
- Chapter 11
- Chapter12
- Chapter 13
- Chapter 14
- Chapter 15
- Chapter 16
- Chapter 17
- Conclusion
- About the Author
Frequently asked questions
Yes, you can cancel anytime from the Subscription tab in your account settings on the Perlego website. Your subscription will stay active until the end of your current billing period. Learn how to cancel your subscription
No, books cannot be downloaded as external files, such as PDFs, for use outside of Perlego. However, you can download books within the Perlego app for offline reading on mobile or tablet. Learn how to download books offline
Perlego offers two plans: Essential and Complete
- Essential is ideal for learners and professionals who enjoy exploring a wide range of subjects. Access the Essential Library with 800,000+ trusted titles and best-sellers across business, personal growth, and the humanities. Includes unlimited reading time and Standard Read Aloud voice.
- Complete: Perfect for advanced learners and researchers needing full, unrestricted access. Unlock 1.5M+ books across hundreds of subjects, including academic and specialized titles. The Complete Plan also includes advanced features like Premium Read Aloud and Research Assistant.
We are an online textbook subscription service, where you can get access to an entire online library for less than the price of a single book per month. With over 1.5 million books across 990+ topics, we’ve got you covered! Learn about our mission
Look out for the read-aloud symbol on your next book to see if you can listen to it. The read-aloud tool reads text aloud for you, highlighting the text as it is being read. You can pause it, speed it up and slow it down. Learn more about Read Aloud
Yes! You can use the Perlego app on both iOS and Android devices to read anytime, anywhere — even offline. Perfect for commutes or when you’re on the go.
Please note we cannot support devices running on iOS 13 and Android 7 or earlier. Learn more about using the app
Please note we cannot support devices running on iOS 13 and Android 7 or earlier. Learn more about using the app
Yes, you can access The 12-Lead Electrocardiogram for Nurses and Allied Professionals by Mark Cowan, MD in PDF and/or ePUB format, as well as other popular books in Medicine & Medical Theory, Practice & Reference. We have over 1.5 million books available in our catalogue for you to explore.