- 258 pages
- English
- ePUB (mobile friendly)
- Available on iOS & Android
eBook - ePub
GIS Technology Applications in Environmental and Earth Sciences
About this book
This book starts with an overview of GIS technology, what GIS technology is, what it can do, what software products are available, etc. Then, throughout the book, the author explains with many case studies, programs, maps, graphics, and 3D models how GIS and other related technologies can be used to automate mapping processes, collect, process, edit, store, manage, and share datasets, statistically analyze data, model, and visualize large datasets to understand patterns, trends, and relationships to make educated decisions. This book is an excellent resource for anyone who is interested in GIS and related technologies, geology, natural resource, and environmental science.
Tools to learn more effectively

Saving Books

Keyword Search

Annotating Text

Listen to it instead
Information
Topic
Physical SciencesSubtopic
Environmental Science1
General Overview of GIS
What Is GIS?
A Geographic Information System (GIS) is a computer system that helps users to collect, process, edit, store, manage, share, analyze, model, and visualize large volumes of datasets to understand spatial relationships, patterns, and trends, and make educated and sound decisions. The two key words in its name, “geographic” and “information,” make GIS a unique technology, different in many ways from other traditional cartographic mapping and data management systems and applications. “Geographic” (also known as geospatial or spatial) means that GIS mainly deals with spatial data features, which are in one way or another references to locations on the earth, such as sampling location points, utility lines, and land parcel polygons. By manipulating spatial data layers (also known as themes), GIS is capable of producing maps similar to other mapping systems, such as a computer-aided design and drafting (CADD) system.
In addition to mapping capabilities, GIS incorporates tabular data (i.e., “information”) and links information to spatial data features (e.g., attaching analytical results to sampling locations) to enable data analysis, modeling, and visualization for better understanding of data and making decisions. For example, by analyzing the population/demographic information, traffic, existing business, and client data layers of an area with a GIS, a business owner or manager will be able to identify the best locations for businesses, such as shopping centers, restaurants, hotels, offices, warehouses, service facilities, and so on. For an environmentally impacted area, by analyzing historical and current aerial photos, sampling results, water wells, hydrology, geology, biology, census, parcels, and other related datasets, scientists and decision-makers can better understand the site history and its current conditions; evaluate its risks to ecosystems, the environment, and human health; model or simulate its possible future impacts; and design the most appropriate remedial approaches to mitigate the situation and clean up the site.
During a GIS conference, one presentation discussed how GIS technology was used in a flooding disaster assessment and its relief efforts. After massive flooding in a south Asian region, airports and road connections to the outside world were severely damaged. It was impossible to go there quickly to survey the affected areas and accurately prepare disaster relief plans. Luckily, using social media, some local residents and officials managed to send out valuable information about the flooding, such as pictures and locations of the places where people were stranded, usable road segments, still-functioning facilities, and so on. GIS technology was used to gather and process these datasets to help United Nations and local officials to quickly assess the situation and coordinate relief efforts from outside and inside the affected region.
GIS is widely used in natural/cultural resource management and conservation, environmental investigation and remediation, geosciences, engineering, logistics, planning, transport, utilities, telecommunication, aviation/navigation, surveying, demographic studies, epidemiology, emergency management, disaster relief, humanitarian aid, forestry, agriculture, oil/gas/mineral exploration, mining, real estate, retail/warehousing/distribution, insurance, health/medical resource management, education, training, tourism, security, law enforcement, reconnaissance, military operations, and many other fields.
GIS Data
The most important and essential component of any GIS is data, which includes both spatial datasets and their associated metadata. Spatial data (also commonly referred to as geospatial data, geographic data, or GIS data) is data or information about the locations and shapes of physical features and the relationships between them. The locations and shapes of features are usually stored as coordinates, commonly known as X, Y, and Z values in a projected coordinate system, or latitude, longitude, and altitude in a geographic coordinate system. The relationships between features are stored as topology, which represents geometric properties, spatial relations, and the arrangement of the features. With stored information about the locations, shapes, and their relationships of features, spatial datasets (also known as data layers or themes) can easily be manipulated and analyzed in GIS to find useful information, patterns, and trends to make educated and sound decisions. This is the unique power of GIS.
Due to its spatial nature, a special database format, a geodatabase, is needed to store GIS data. Major relational database management systems (RDBMS) have tools and/or utilities to design, develop, deploy, populate, and manage geodatabases, such as IBM DB2, IBM Informix Dynamic Server, Microsoft Access, Microsoft SQL Server, Microsoft SQL Server Express, Microsoft SQL Azure, PostgreSQL, Oracle, and so on.
Metadata is the data or information that describes the spatial dataset. The prefix meta in Greek means “after,” “along with,” “beyond,” “among,” and “behind.” It adds to the name of something references, comments, and/or other information. In order for GIS data users to precisely understand, interpret, exchange, and reuse spatial data, data production processes are documented and saved (along with other relevant information about the data) as metadata. A metadata file contains detailed information about the spatial data, such as its name, purpose, spatial domain/bounding coordinates, scale, projection/coordinate system, data originators, dates/times, keywords, use constraints, data quality/accuracy, sources, production processes, data formats, attributes/fields, legal disclaimers, distribution/access, and so on. Figure 1.1 shows an example of a metadata document. It is the first page (i.e., the data “Identification Information” section) of the metadata file of a U.S. Geological Survey (USGS) digital topographic 7.5 minute quadrangle image spatial data. As listed on the top of this first page, the whole metadata file contains six sections, that is, the Identification Information, Data Quality Information, Spatial Data Organization Information, Entity and Attribute Information, Distribution Information, and Metadata Reference Information. The Identification Information section contains general information about the spatial data, including data producer/originator (e.g., USGS Earth Science Information Center), publication place and date, abstract, purpose, quad name (e.g., Cumberland Island South), DRG number (e.g., O30081G4), area/perimeter of the data coverage, data units (e.g., meters), minimum and maximum coordinates, data scale (e.g., 1:24,000), UTM zone (e.g., 17), time period of the data, data production status (e.g., complete), data maintenance/update information, keywords, spatial domain/bounding coordinates, and other relevant information.
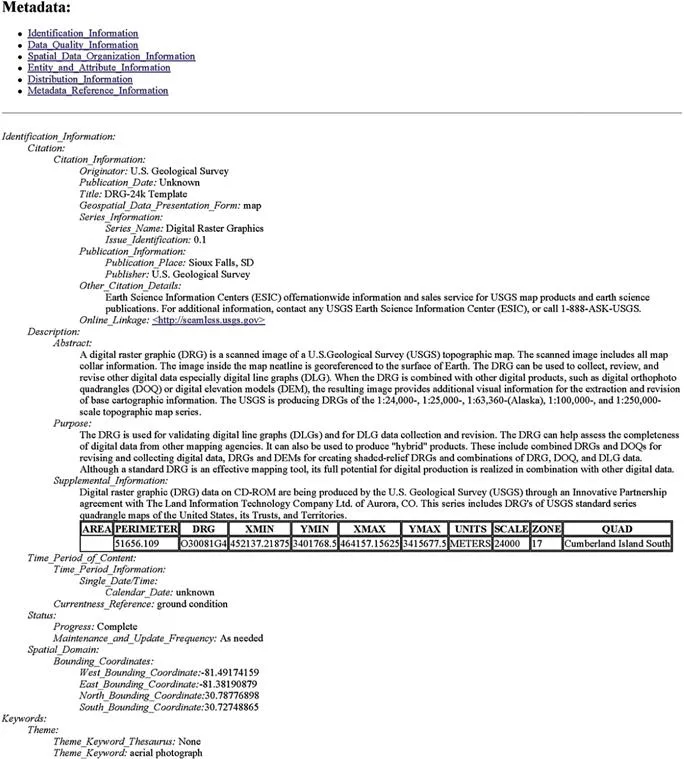
FIGURE 1.1
An example metadata of a United States Geological Survey (USGS) digital topographic 7.5 minute quadrangle image data, also known as a digital raster graphic (DGR), which is often used as background image in GIS maps.
An example metadata of a United States Geological Survey (USGS) digital topographic 7.5 minute quadrangle image data, also known as a digital raster graphic (DGR), which is often used as background image in GIS maps.
All federal agencies of the United States are mandated by Executive Order 12906 to use metadata standards endorsed by the Federal Geographic Data Committee (FGDC). The current FGDC-endorsed and widely used standard is the Content Standard for Digital Geospatial Metadata (CSDGM). Its biological extension is the Biological Data Profile (BDP). The FGDC has also endorsed the adoption of the International Organization for Standardization (ISO) series of standards (19115, 19115-2, and 19139). A transition to the ISO series of standards is already underway. Both CSDGM and ISO require metadata to be formatted in Extensible Markup Language (.xml), although many old-version metadata files are in HyperText Markup Language (HTML), TXT, Microsoft Word, and other formats.
There are a variety of free or commercial software tools with a wide range of features and capabilities to create, edit, and validate metadata files. A few well-known and commonly used metadata software tools are briefly discussed below.
Freeware/Shareware Metadata Tools
• EPA Metadata Editor (EME): This is an extension to ESRI’s ArcGIS ArcCatalog software product. ArcGIS users can utilize this EPA Metadata Editor to create and edit records that meet the EPA Geospatial Metadata Technical Specification and the FGDC CSDGM requirements.
• NOAA MERMAid (Metadata Enterprise Resource Management Aid): Developed and maintained by the National Oceanic and Atmospheric Administration (NOAA)’s National Centers for Environmental Information (NCEI)’s Center for Coasts, Oceans, and Geophysics (CCOG), MERMAid is an online metadata editor for creating, editing, validating, storing, and exporting metadata records. It supports the FGDC CSDGM with the BDP, the Shoreline Profile, the Remote Sensing (RS) Extension, Ecological Metadata Language (EML), and Machine-Readable Cataloging (MARC). It can be used for metadata conversion among these standards too. The NOAA recently announced that MERMAid would be discontinued as of September 30, 2016, in line with the overall trend of transitioning from FGDC CSDGM metadata standard to the ISO series of standards of 19115, 19115-2, and 19139.
• USDA Metavist: Produced and maintained by the USDA Forest Service, Metavist is a stand-alone desktop metadata editor for creating metadata compliant with the FGDC CSDGM metadata standard and the National Biological Information Infrastructure (NBII) 1999 BDP for the FGDC standard. The output metadata is in XML format, required by the FGDC CSDGM metadata standard.
• USGS Online Metadata Editor (OME): OME is an online metadata editor for creating FGDC CSDGM-compliant metadata records by answering questions about the spatial data. It can be used to create new metadata records or upload/edit existing ones. Metadata records can be saved either online or locally to a desktop computer. This special online metadata tool is currently available to USGS staff only.
• USGS Metadata Wizard: This is a metadata tool that works with ESRI’s ArcGIS Desktop for generating FGDC CSDGM-compliant metadata for geospatial datasets. This metadata tool is a Python toolbox for ESRI ArcGIS Desktop software, which processes geospatial datasets and creates/updates metadata records in ESRI’s ArcGIS software.
• USGS Metadata Parser (MP): Developed and maintained by the USGS, MP is a metadata quality control and output configuration tool. It supports Linux, UNIX, and all versions of Microsoft Windows operating systems. It works as a compiler to parse metadata, that is, checking the syntax of the metadata against the FGDC CSDGM standard and generating error reports that can be viewed with - either a Web browser or text editor. It is multilingual, supporting French and Spanish. It can be configured for the BDP and other extensions.
• Microsoft XML Notepad: XML Notepad is an open-source lightweight metadata tool published by Microsoft. It can be used to view, edit, and validate existing metadata records and XML documents. However, it does not create FGDC CSDGM metadata records. With a special schema package, XML Notepad can be used to validate metadata records.
Commercial Metadata Tools
• ESRI’s ArcCatalog: With ArcCatalog, the existing metadata of a spatial data layer can be viewed, edited, and validated. For a data layer without any metadata associated with it, ArcCatalog can automatically create a basic metadata file for it with items and formats compliant with either the FGDC CSDGM metadata standard or the ISO series of standards of 19115, 19115-2, and 19139. From the information of the spatial data, ArcCatalog automatically fills in some of the items in the metadata file, such as the title, thumbnail, spatial domain/bounding coordinates, scale, projection/coordinate system, attributes/fields, and so on. An existing or newly created metadata file can be edited easily within ArcCatalog, similar to a text editor.
• GeoMedia Catalog: Intergraph’s GeoMedia Catalog is capable of creating, managing, and publishing metadata records compliant with FGDC CSDGM, ISO 19139, and other metadata standards. Since GeoMedia Catalog associates spatial data and metadata catalog entries together, it can automatically extract from the spatial data the information for some metadata elements, such as bounding coordinates, point and vector object counts, native data environment, entity/attributes, and so on. GeoMedia Catalog allows multiuser access to the GeoMedia Catalog metadata repository through multiple GeoMedia Catalog clients using Microsoft Access, SQL Server, or Oracle databases.
• MapInfo Manager: Pitney Bowes MapInfo Manager is a server-based GIS application. With MapInfo Manager, users can create and edit metadata compliant with the ISO 19115 metadata standard. Some metadata-generating processes can be automated using templates and/or performed in a bulk collection effort, referred to as harvesting.
There are two primary types or formats of spatial data, that is, vector data and raster data. The vector data format is more commonly used. In a GIS, vectors are geographically enabled geometrical shapes. Their primitive types include zero-dimensional points, one-dimensional lines, and two-dimensional polygons. Examples of point features are sampling locations, monitoring stations, wells, fire hydrants, traffic signs, and so on. On a small-scale map that shows a large geographic area, such as the whole world, a continent, or a large country, cities are represented as points. However, on a large-scale map that shows a small area, such as a state/province or a county, cities are displayed as polygons. Examples of line features include utility lines (power lines, water/sewer networks, oil and gas pipelines), streams, rivers, shorelines, survey paths, roads, rail tracks, and so on. However, on large-scale maps, some line features can become polygons, for example, roadways, rail tracks, easements, large rivers, and so on. Polygon features are the most common geometrical shapes on the earth’s surface. Figure 1.2 is an example of a GIS map showing groundwater monitoring wells (red stars) as points, streams (cyan) as lines, and a volatile organic compound (VOC)-contaminated groundwater area (shaded in yellow) as a polygon. The changes of the chemical concentrations in the groundwater during the 9-year sampling period were displayed as a line graphic and data table for each well. The line graphics and tables were created with the Microsoft Access database or Excel and converted into PDF files. The PDF files were linked to the monitoring wells on the GIS map. When a monitoring well is clicked, detailed information about the well shows up on the GIS map, including the well ID, its coordinates, total depth, depth to groundwater, permit info, construction date, construction diagram, sampling information, chemicals analyzed, chemical concentratio...
Table of contents
- Cover Page
- HalfTitle Page
- Title Page
- Copyright Page
- Dedication Page
- Contents
- Preface
- Acknowledgments
- Author
- 1. General Overview of GIS
- 2. Collecting Field Data More Efficiently with GIS and GPS Technologies
- 3. Processing and Analyzing Data to Extract Useful and Meaningful Information
- 4. Mapping and Analyzing Geology Data with GIS
- 5. Data Modeling and Visualization
- 6. Sharing GIS Data and Maps through the Internet
- Commonly Used Acronyms in GIS and Environmental Science
- Bibliography
- Index
Frequently asked questions
Yes, you can cancel anytime from the Subscription tab in your account settings on the Perlego website. Your subscription will stay active until the end of your current billing period. Learn how to cancel your subscription
No, books cannot be downloaded as external files, such as PDFs, for use outside of Perlego. However, you can download books within the Perlego app for offline reading on mobile or tablet. Learn how to download books offline
Perlego offers two plans: Essential and Complete
- Essential is ideal for learners and professionals who enjoy exploring a wide range of subjects. Access the Essential Library with 800,000+ trusted titles and best-sellers across business, personal growth, and the humanities. Includes unlimited reading time and Standard Read Aloud voice.
- Complete: Perfect for advanced learners and researchers needing full, unrestricted access. Unlock 1.4M+ books across hundreds of subjects, including academic and specialized titles. The Complete Plan also includes advanced features like Premium Read Aloud and Research Assistant.
We are an online textbook subscription service, where you can get access to an entire online library for less than the price of a single book per month. With over 1 million books across 990+ topics, we’ve got you covered! Learn about our mission
Look out for the read-aloud symbol on your next book to see if you can listen to it. The read-aloud tool reads text aloud for you, highlighting the text as it is being read. You can pause it, speed it up and slow it down. Learn more about Read Aloud
Yes! You can use the Perlego app on both iOS and Android devices to read anytime, anywhere — even offline. Perfect for commutes or when you’re on the go.
Please note we cannot support devices running on iOS 13 and Android 7 or earlier. Learn more about using the app
Please note we cannot support devices running on iOS 13 and Android 7 or earlier. Learn more about using the app
Yes, you can access GIS Technology Applications in Environmental and Earth Sciences by Bai Tian in PDF and/or ePUB format, as well as other popular books in Physical Sciences & Environmental Science. We have over one million books available in our catalogue for you to explore.