Advances in Materials and Pavement Prediction
eBook - ePub

Advances in Materials and Pavement Prediction

Papers from the International Conference on Advances in Materials and Pavement Performance Prediction (AM3P 2018), April 16-18, 2018, Doha, Qatar

  1. 596 pages
  2. English
  3. ePUB (mobile friendly)
  4. Available on iOS & Android
eBook - ePub

Advances in Materials and Pavement Prediction

Papers from the International Conference on Advances in Materials and Pavement Performance Prediction (AM3P 2018), April 16-18, 2018, Doha, Qatar

Book details
Book preview
Table of contents
Citations

About This Book

Advances in Materials and Pavement Performance Prediction contains the papers presented at the International Conference on Advances in Materials and Pavement Performance Prediction (AM3P, Doha, Qatar, 16- 18 April 2018).

There has been an increasing emphasis internationally in the design and construction of sustainable pavement systems. Advances in Materials and Pavement Prediction reflects this development highlighting various approaches to predict pavement performance. The contributions discuss links and interactions between material characterization methods, empirical predictions, mechanistic modeling, and statistically-sound calibration and validation methods. There is also emphasis on comparisons between modeling results and observed performance. The topics of the book include (but are not limited to):

• Experimental laboratory material characterization
• Field measurements and in situ material characterization
• Constitutive modeling and simulation
• Innovative pavement materials and interface systems
• Non-destructive measurement techniques
• Surface characterization, tire-surface interaction, pavement noise
• Pavement rehabilitation
• Case studies

Advances in Materials and Pavement Performance Prediction will be of interest to academics and engineers involved in pavement engineering.

Frequently asked questions

Simply head over to the account section in settings and click on “Cancel Subscription” - it’s as simple as that. After you cancel, your membership will stay active for the remainder of the time you’ve paid for. Learn more here.
At the moment all of our mobile-responsive ePub books are available to download via the app. Most of our PDFs are also available to download and we're working on making the final remaining ones downloadable now. Learn more here.
Both plans give you full access to the library and all of Perlego’s features. The only differences are the price and subscription period: With the annual plan you’ll save around 30% compared to 12 months on the monthly plan.
We are an online textbook subscription service, where you can get access to an entire online library for less than the price of a single book per month. With over 1 million books across 1000+ topics, we’ve got you covered! Learn more here.
Look out for the read-aloud symbol on your next book to see if you can listen to it. The read-aloud tool reads text aloud for you, highlighting the text as it is being read. You can pause it, speed it up and slow it down. Learn more here.
Yes, you can access Advances in Materials and Pavement Prediction by Eyad Masad,Amit Bhasin,Tom Scarpas,Ilaria Menapace,Anupam Kumar in PDF and/or ePUB format, as well as other popular books in Technology & Engineering & Civil Engineering. We have over one million books available in our catalogue for you to explore.

Information

Publisher
CRC Press
Year
2018
ISBN
9780429855795
Edition
1

Section 1: Modeling distress in flexible pavements

Modeling the relationships between pavement distress and performance

Yu Qiao & Sikai Chen

School of Civil Engineering, Purdue University, USA
Majed Alinizzi
Qassim University, Kingdom of Saudi Arabia
Samuel Labi
School of Civil Engineering, Purdue University, USA
ABSTRACT: A key aspect of pavement management systems is the need for reliable pavement condition data because this data are used to assess pavement network condition, to schedule Maintenance and Rehabilitation (M&R), and to estimate the level of funding needed for M&R. Poor quality of data leads to misclassification of the pavement condition, mistiming of M&R investments, inaccurate reporting of the effectiveness of individual projects or systemwide programs, and ultimately, wasteful spending of agency budgets or user frustration due to unduly deferred maintenance. Reporting pavement condition for a wide variety distress indicators across the entire carriageway and over several miles means that massive amount of data need to be collected. This study developed Gaussian-distribution regression models that captured the relationship between pavement indicators. The developed models could use a single indicator to predict the occurrence or severity of other indicators, which could help reduce data collection and processing efforts.

1 INTRODUCTION

At the current time, the need for reliable pavement condition data is exacerbated by resource constraints at state highway agencies. In their quest for cost-effective techniques and to minimize human error and resource consumption that are associated with manual techniques, agencies have resorted to automated data collection techniques (Wang and Gong 2005; Zalama et al. 2014). Such automation has been facilitated by advancements in computer and information technology, particularly for capturing and processing digital images (Wang 2011). Fully automated methods involve minimal human involvement in data collection process. Typically, the operator drives the sensor-equipped vehicle driven over the pavement section and the pavement condition information is collected at normal driving speed. The pavement condition is often reported in terms of a performance indicator (PI), which are standard measurements that reflect the extent and the severity of surface distresses and defects including cracking, rut depth, and roughness.
The need to report pavement condition for a wide variety of distress indicators, across the entire carriageway width, and over several miles means that massive amounts of data are collected. Therefore, automated methods represent both virtue and vice: while facilitating data collection and reduction of human effort, they produce enormous amounts of data that make it difficult to analyze using manual or semi-manual techniques. If the relationship between these indicators can be quantified with a high degree of confidence, then there is little or no need to collect data on all the distress indicators: data on a single indicator could be used to predict the occurrence or severity of other indicators. If that is the case, then the data collection and processing effort (time and cost) can be drastically reduced. This paper addresses this issue.
The dataset used in this paper contains data collected by the Indiana DOT in 2012–2014 for every 0.005 mile at I-70, US-52 and US-41. The paper uses the data to study the relationships between IRI and the occurrence of standard crack types. The paper developed Gaussian-distribution regression models to fit the actual data, and to predict the probability that a specific pavement of known IRI will have a certain type and severity of cracking distress.

2 METHODOLOGY

This section describes the methodology used to develop models to predict the probability of having a certain type of crack and the crack severity levels, given the IRI of the pavement segment. As a first step, the probability (observed) of the existence of each pavement crack type on a pavement of a specific IRI was estimated as the percentage of pavement segments where the crack occurs to the total number of pavement segments in that IRI range. For example: if there are 50 out of 1000 pavement segments, whose IRIs range from 80 to 100 in/mile, have low-severity wheel path longitudinal cracking, then the probability of existence of low-severity longitudinal cracking is: 50/1000 = 5% (given that the IRI is between 80 and 100 in/mile). The general formulation is:
P ( xi, width>0|I1< IRI <I2)=Nxi,I1<IRI<I2NT,I1<IRI<I2
(1)
where, xi,width = crack width of pavement crack type i; P(xi,width < 0|Ii IRI < I2) = percentage of pavements where crack i is observed (crack width > 0 in the dataset) and where IRI is between I1 and I2 to the total nr. of pavements within the same IRI range; I1 and I2 are the lower bound and the upper bound of the given range of IRI, respectively; NT,I1 < IR < I2 is the nr. of pavement segments with IRI in the I1 – I2 range; Nxi,I1 < IRI < I2 is the nr. of pavement segments with cracking i and with IRI in the I1 – I2 range.
The choice of the IRI interval between I1 and I2 is a trade-off between the sample size and the model reliability. Therefore, after comparing the model results for different intervals, an IRI range of 20 in/mile, i.e., I1 – I2 = 20 was used. Also, to ensure that the estimated probability within each interval is reliable, only the samples from the intervals with over 30 observations were used.
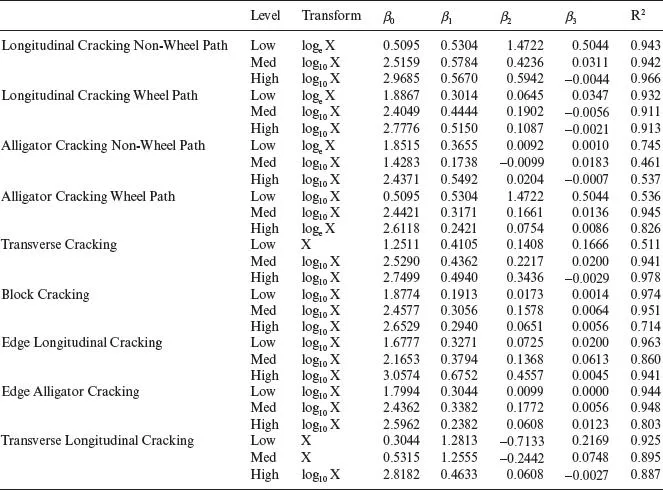
The distributions of the estimated probability are highly skewed, therefore, for most crack types, the independent variable was log-transformed prior to the modeling. Different functional forms including the traditional non-linear equations (exponential, power, logarithm, etc.) were tested but were found not to provide the expected shape of the probability curves that were estimated in this paper. A set of probability distribution functions including Beta distribution, Gamma distribution and Gaussian distribution were also tested. Finally, a modified Gaussian function (Eq. 2) was found to perfectly capture the characteristics of the developed probability curves (see “Model results”):
Table 1. Regression model results for Gaussian equations.
Image
Image
Figure 1. Probability distribution for Longitudinal Non-Wheel Path Crack.
Image
Figure 2. Model validation for Longitudinal Non-Wheel Path Cra...

Table of contents

  1. Cover
  2. Half Title
  3. Title Page
  4. Copyright Page
  5. Table of Contents
  6. Preface
  7. Keynotes
  8. Session 1: Modeling distress in flexible pavements
  9. Session 2: Integrating material and structural response
  10. Session 3: Structural health assessment
  11. Session 4: Measuring and modeling mixture performance – 1
  12. Session 5: Measuring and modeling mixture performance – 2
  13. Session 6: Computational modeling to understand mixture production and behavior
  14. Session 7: Measuring and modeling performance of asphalt binders
  15. Session 8: Binders and emulsions: Workability, adhesion and rheology
  16. Session 9: Recycling in asphalt mixes
  17. Session 10: Modeling and measurement of noise and tire-pavement interaction
  18. Session 11: Pavement roughness: Measuring, modeling and implications – 1
  19. Session 12: Pavement roughness: Measuring, modeling and implications – 2
  20. Session 13: Developments in structural design of pavements
  21. Session 14: Variability in mixture and pavement design
  22. Session 15: Mixes and binders with additives and industrial waste
  23. Session 16: Chemomechanics and aging of binders – 1
  24. Session 17: Chemomechanics and aging of binders – 2
  25. Session 18: Rigid pavements 1
  26. Session 19: Rigid pavements 2
  27. Session 20: Pavement geotechnics 1
  28. Session 21: Pavement geotechnics 2
  29. Session 22: Innovations in pavement maintenance, analysis, and design
  30. Session 23: New asphalt mix paradigms
  31. Session 24: Modeling and measurement of chip seals
  32. Author index