![]()
1
Introduction
1.1 Is This the Book for You?
If you are interested in statistics and good at mathematics, this is probably not the right book for you. This book is aimed at geography students who are not particularly interested in statistics, perhaps lack a bit of confidence in their mathematical abilities, but want to be able to analyse data properly in order to make sense of projects, including dissertations, and get better marks.
This is very firmly where I stood as a student. I had good reason to lack confidence in my mathematical abilities and I was not just disinterested in statistics, I was terrified. I was, however, very interested in geography and soon realised that I needed to be able to understand and use statistical methods in order to make sense of much of the literature and to analyse my own data. I struggled with the ‘methods’ courses as an undergraduate, partly because they were taught largely by people who were very good at mathematics and statistics and they could not bring the material down to my level. In the end, I gave up on the lectures, bought a book and worked my way through it at my own very slow pace. Eventually, the ‘penny dropped’ and I understood enough. My aim was never to be good at statistics, I just wanted to be able to choose the simplest test that was suitable for the problem at hand, apply it properly, and be able to explain the results. My aim in this book is to get you to that same level.
If you know a little bit about statistical methods, you may spot that this book is rather unusual. Most books on statistical methods start with long explanations of abstract concepts like the ‘Gaussian’ or ‘normal distribution’ and there are pages and pages of warnings about assumptions before you ever get to any actual tests. That is because most books focus on tests that are called ‘parametric’ and which require a lot of assumptions. The alternative ‘nonparametric’ tests are usually reserved for those cases where the assumptions are not met. Here, I take a different approach and focus mainly on the nonparametric tests. This is not because they are simpler to understand or easier to apply, it is because I think they are the most useful and appropriate tests for most of the projects that geography students will tackle. They are suitable for quite small data sets, can be used when you are collecting data that is not in the form of individual measurements, for example, where you just have counts in categories, and they can cope with data that includes the odd extreme value. Because there are very few assumptions, once you have grasped a few basic concepts, like forming hypotheses and understanding probabilities, you can usually apply them without having to use complicated equations or fancy software. Students sometimes worry that the nonparametric method may not be ‘as good’ as the parametric equivalent but actually, for the kinds of data they are likely to be using, this is rarely the case and if the data seem to fit the assumptions, then a simple solution is to apply both the parametric and nonparametric tests and check that they give similar results. Some common parametric tests, such as ‘Student’s t-test’, are covered as well.
The book includes sections on correlation, using parametric and nonparametric methods, and on regression. I have included them because they are very useful methods and although they used to be regarded as complicated, they are actually very easy to apply using a spreadsheet. When you use these methods, it is important to be aware of the assumptions and to make some simple checks. It is not really necessary to use complicated techniques to do this, just plotting appropriate graphs and applying a bit of common sense will suffice.
1.2 How to Use This Book
If you are confident that you have formulated clear and testable hypotheses, can understand the difference between a one and a two-tail test, and can interpret probabilities, then you can jump straight to ‘choosing the right test’ (Section 3.4) and get on with it. Otherwise, it is worth reading the introductory sections to make sure that you really understand the basics. There is no point in doing the test properly but then losing marks by demonstrating that you do not really understand what it means. The best way to use this book is to read it before you collect any data, so that you can design your sampling scheme to fit your desired test. In reality, of course, many readers will already have collected the data and are looking for some guidance on how to analyse it. I have tried to lay things out so that you can find the right test for the data you have, even if it has not been collected with any particular test in mind.
Students are often taught to perform all statistical calculations using some specialist software. I really do not see the point in being so prescriptive and have noticed that in many cases, the software is so complicated to use that it acts as a barrier rather than an aid to learning. For me, statistical methods are just tools, it is the research that matters, so I encourage students to use the most convenient method to apply an appropriate test and get the correct result. The most convenient method varies by test, and may include using a calculator, a spreadsheet, or most simply of all a free online calculator. A few tests are easier to perform using specialist software, and I have chosen to use SPSS, because it is commonly used by geographers and will be available to many students and R Commander because it is powerful and free. Where I use a spreadsheet I will give instructions for Excel, which is widely used, but most of the instructions will apply also to the free spreadsheet available via Libre Office. Details of how to access the software are given in the section on ‘tools of the trade’ (Chapter 4). For each of the tests, I have provided some worked examples, so that you can see how the test works, but the focus is on explaining the logic of the test, rather than the mathematics. I realise that students are sometimes required to make calculations, and show the workings, so for most tests, I have added worked examples using equations. These are generally placed into boxes kept separate from the main text and I have tried to show every step in the analysis, so that students who lack confidence can take the same small steps with their own data. I have also produced a set of very simple spreadsheet-based calculators that will perform most of the tests in this book. They use the normal Excel functions and all of the workings are left open to view and editable, with no hidden code, so that you can see how they work.
1.3 Why Bother with Statistics?
The great value of statistical techniques is that they allow you to go beyond simple description of the data that you have collected and say something about the wider world. That step, from simply describing what you can see to making more general statements is called inference. Most of the tests that we use in geography are called inferential statistics. They allow you to make clear statements about your data, and they effectively tell you whether it is safe to go beyond simply describing your data and make inferences about the wider implications of the results. This is perhaps most clearly illustrated by a couple of examples.
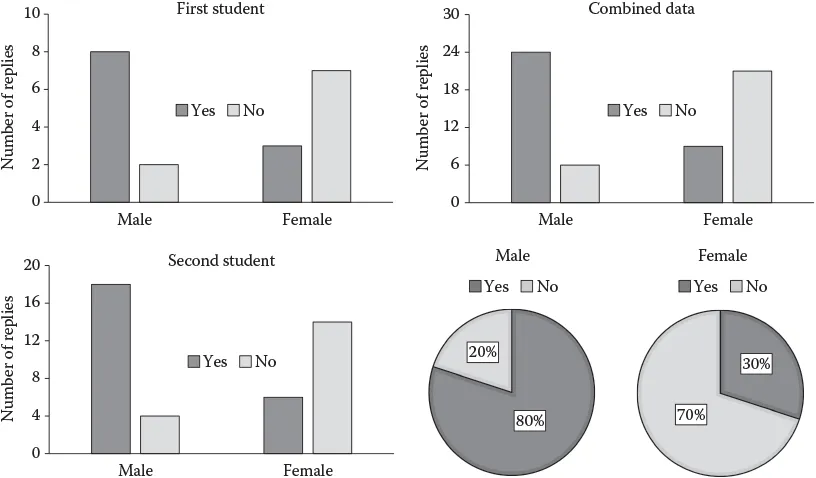
Imagine that you have been told to conduct a questionnaire survey for which the answers are either yes or no. The question does not matter for the moment, it might be something like ‘Does being stopped in the street and asked questions by geography students annoy you?’ We are interested in whether there is some gender difference in the replies and so the results can be plotted as some kind of graph. You could choose a bar graph that shows how many people replied or you could use a pie chart that just shows the proportions or percentages replying yes and no (Figure 1.1).
Without access to statistical tests, all we can do is describe these graphs. For example, one student might find that eight out of the 10 male respondents objected, whereas only three of the 10 female respondents objected. However, with such small samples, it is difficult to say whether the gender difference really reflects the wider population that we are interested in. A reasonable interpretation would be that there is no real difference between males and females and the difference that we see in the small sample is just due to the luck of the draw. Asking a different set of 10 males and 10 females might well result in a very different result.
FIGURE 1.1
Replies to a simple yes or no question arranged according to gender. Changing the sample size does not change the appearance of the graphs but it does change the probability that a gender difference of this magnitude could occur just by chance if there was no real difference in the population. Fisher’s exact test can be used on this kind of data and is very easy to perform using free online calculators.
A second and more industrious student may have conducted the same survey but included more people, finding that 16 out of 20 males objected whereas only 6 from 20 female respondents objected. When this larger data set is plotted on graphs, it does not look much different from those of the first student. The second student might justifiably come to the same conclusion, that there is a difference between males and females in the sample but it is difficult to say whether it is safe to make any inference beyond the sample. Both students are effectively trapped because all they can do is describe the sample that they collected; they cannot say anything about how likely it is that the results reflect similar differences in the population. The second student might justifiably wonder if it was really worth the effort of doubling the size of the sample.
By using a simple statistical test, in this case called ‘Fisher’s exact test’, we are able to come to much clearer conclusions. It is a tricky test to calculate by hand, but luckily there are some free online calculators and all you have to do is enter four numbers to get the result. The only assumption is that the samples are unbiased. The first student, with only 10 respondents from each gender, could conclude that there is a 7% chance, even if there was no real difference between the genders, that such a small sample could yield a difference of the size that was observed ‘just by luck’. We generally (just by convention, there is no strict rule) assume that if the chances of something occurring ‘just by luck’ are more than 5% then it is too risky to accept that the observed difference is real. There would be little point in rambling on about the gender difference in this case, because the sample is just too small to be confident that the difference is real.
The second student, with the larger sample, could apply the same test and would find that the chances of obtaining this split in response just by luck, if there was no gender difference in the wider population, is about 0.4%, which is four in a thousand or one in 250. A 250 to one chance is pretty long odds, so this student can conclude that the sample is large enough to be confident that there is a gender difference and rambling on about the reasons for it is fully justified. If the two students were to combine their data, giving samples of 30 for each gender, they would find that the probability of a difference of this magnitude occurring just by luck is about two in 10,000, or 5,000 to one.
As an alternative example, consider a physical geographer who has trekked into the mountains to look at moraine ridges formed by small glaciers in response to climate changes in the past. She might want to use the degree of rock weathering to see whether two moraines are very similar in age or whether they represent glacial advances that are well separated in time. The Schmidt hammer is a simple hand-held tool used by engineers to measure the hardness of concrete, but since weathering tends to result in a reduction in rock surface hardness, it is also used by geomorphologists (Goudie 2006; Darvill et al. 2015). A reasonable sampling strategy might be to record one ‘rebound value’ from each of 30 boulders on each moraine ridge crest and compare the results using histograms (Figure 1.2). Without recourse to statistical methods, it is quite difficult to decide whether the two sets of results are different enough to conclude that there is probably a difference in degree of rock weathering and therefore age of moraine.
In fact, there is a very nice little statistical test that can be used to compare two sets of data like this, even when they are clearly a bit skewed to one side and have some extreme values. It goes by a variety of names, but in this book I have called it the ‘Mann–Whitney U-test’. It is not difficult to calculate using a spreadsheet. It involves putting all 60 values in rank order, ignoring which sample they come from, and then separating the two samples and comparing the sums of the ranks. If that sounds like too much work, you can just cut and paste the two sets of data into another online calculator and click on ‘calculate’. In this case, the student can conclude that there is less than a one in a thousand chance that the two samples of Schmidt hammer rebound values would be as different as they are if there was no difference in rock hardness, and therefore degree of rock weathering. Of course, the student needs to be careful to ensure that it is sensible to compare the two moraines in this way, making sure, for example, that the geology is the same, but in that case, it would be reasonable to conclude that there is a substantial difference in the age of the two moraines. If she has Schmidt hammer values from moraines that have been independently dated, perhaps using a mixture of old photographs and dendrochronology of trees uprooted by the advancing glacier and incorporated into moraines, she might even be able to use other statistical methods (correlation and regression) to estimate the age of the undated moraines (Shakesby et al. 2006, 2011).
FIGURE 1.2
Schmidt hammer rebound values obtained from two moraine ridges. The Mann–Whitney U-test reveals that there is less than a one in a thousand chance that such a large difference would be found between two unbiased samples if the moraines were about the same age and there was no real difference in boulder surface hardness.
As a geography student, you should not be afraid of ‘statistics’, even if you are not good at mathematics. This is the twenty-first century and we are surrounded by computers and access to the internet. To apply most statistical techniques, you do not need any mathematical skills at all, you just need to be able to type the numbers into a spreadsheet and then cut and paste them into either an online calculator or a software package. Applying statistical methods has become really quick and easy. However, being able to perform a particular test is not much use unless you know how it works, when to use it and can make sense of the results. I hope that this book will give you those skills and the confidence to use a range of statistical methods and get better marks as a result.
1.4 A Note for Lecturers and Teachers
Teaching statistical techniques and other numerical methods to geography students is not an easy task. Of course, some geography students have excellent numerical skills, but many of those who are drawn to study the subject lack confidence in their mathematical abilities. Do not be fooled into thinking that this means they are stupid; confidence in mathematical ability is often much more to do with the quality of teaching at school than with the raw ability of the student. I have found that many geography students, including some extremely intelligent ones, are simply terrified of anything that involves numbers. The simple option, of course, is to remove numerical techniques from the curriculum, but personally, I think that is an abrogation of responsibility on our part. Our students need to leave university with a skill set that prepares them for the world of employment. It is one of the great benefits of a geography degree that students obtain many transferable skills and although I would not argue that the ability to use statistical tests is the most important, I do think that improving their numerical skills, and especially their confidence in their numerical skills, is one of the best things we can do for them.
Traditionally, numerical methods courses in geography have focussed on parametric statistics and students have been taught using specialist software. This is unfortunate, because to use parametric statistics properly, it is important to understand the concept of probability distributions, and that forms an immediate barrier to students who lack confidence with mathematics. At the same time, they are faced with specialist software that is so complicated that, rather than facilitating the easy application of statistical methods, actually becomes another barrier to learning.
In my own teaching, and in this book, I promote a different approach to teaching statistical methods to geography students, and that is to f...