
- 548 pages
- English
- ePUB (mobile friendly)
- Available on iOS & Android
eBook - ePub
Building-Integrated Solar Energy Systems
About this book
This book presents techniques for building and optimizing structures with integrated solar energy systems. It describes active solar systems such as photovoltaics and parabolic concentrators as well as passive solar systems and covers optimal materials to use, daylighting, shading, solar blinds, rock and water energy storage and more. It discusses the best ways to site a solar structure considering exposure, elevation, slope, clearance, wind protection, etc. The book includes numerous full-color figures and more than 100 MATLAB® files.
Tools to learn more effectively

Saving Books

Keyword Search

Annotating Text

Listen to it instead
Information
Chapter 1
Energy Sources, Energy Uses, and Global Warming
The energy available for use on Earth has two sources — solar and nuclear. The Sun’s energy is generated by nuclear fusion of hydrogen into helium during which some mass M is lost to produce energy E, according to Albert Einstein’s famous formula E = MC2 where C is the speed of light in a vacuum. Thus, it could be argued that the only source of energy is nuclear. So how is the solar energy reaching Earth used, stored, or lost? That is the subject of this chapter.
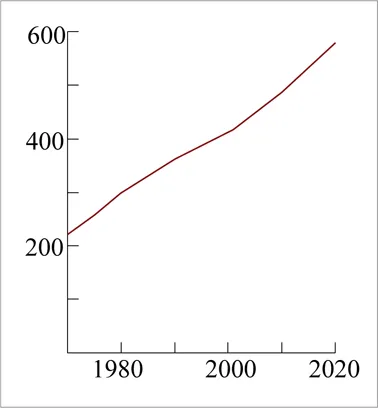
Figure 1.1: Worldwide Energy Use in Exajoules
The SI (Système International) units to describe energy and power are the joule J and the watt W, where 1 joule equals 1 watt second, or 1 J = 1 W·s. These units are small. Residential electric power is measured in kilowatts (kW), and customers of the electric utility company are billed based on the number of kilowatt hours (kWh) they consume. To determine the total amount of energy used worldwide, we need a much larger measure since numbers with many zeros at the end are difficult to comprehend. The standard is the exjoule (EJ), defined as 1018 J. World energy use in EJ is shown in 1.1. Approximate equivalents are:
Worldwide energy use is now increasing by about 71 EJ per decade. It is difficult to see this energy use decreasing since population growth and increased living standards require more energy. The challenge for the future is to replace energy generated from fossil fuels with renewable energy.
1.1 History of Fossil Fuels
Fossil fuels are hydrocarbons and were formed in the Carboniferous Period from about 360 to 286 million years ago, when much of the Earth was forested. Much of the land was swampy with ferns and a great variety of leafy plants as well as huge trees. When such plants die and fall into the swamp, the waterlogged material sinks to the bottom and over time gets covered in sediment, and peat is formed as a wet, spongy substance.
Peat remains a popular domestic fuel in Ireland. It is cut out of the ground in slabs and air dried before burning in fireplaces. It is a dirty fuel, but is free for the taking, so the price to be paid, apart from the cost to the environment, is the labor of harvesting and drying.
Over time peat becomes covered with more and more material, silt, sand, rock, etc., and the pressure on the peat converts it to lignite, a soft coal. Additional compression and time and the lignite becomes bituminous coal. Eventually, it becomes anthracite, a hard coal.
Some coal deposits of coal were formed in the late Cretaceous period of 65 million years ago, but these deposits are considerably smaller than those of the Carboniferous Period. Late forming coal is less compacted and contains more moisture; it is often called “brown coal.”
Fossil fuels remained largely untouched until the Industrial Revolution. Initially, water power provided the motive power for the textile mills in Northern England. The Massachusetts towns of Lowell and Lawrence copied the English model, and other New England towns followed, producing great wealth for the mill owners. But the amount of power to be extracted from rivers is limited, and we have harnessed most of the power from rivers.
The English moved from total reliance on water power to a predominance of coal power. The coal seams of England are, by chance, near the textile manufacturing centers, so soon coal became the fuel of choice. This was not the same in New England, and a variety of factors led to the collapse of textile manufacturing in New England and its displacement to the South to be closer to cotton.
The thickness of an English coal seam can be as thin as a film, or as thick as 15 m. Seams as thick as 60 m can be found in India and France.
When coal was discovered around 1750, not much was made of it. It was difficult to burn in a fireplace made for wood. Transportation difficulties were dominant. Then blacksmiths found it a longer lasting fuel than wood with more energy per unit volume. Shipments from the principal coal mine near Wilkes Barre, Pennsylvania, was 365 tons in 1820, but increased to 40,000 tons in 1822, and 140,000 tons in 1833. A major industry was born, supported by an increasingly effective and fossil fueled railroad network. However, it was only until 1855 that the use of coal surpassed that of charcoal, made from wood.
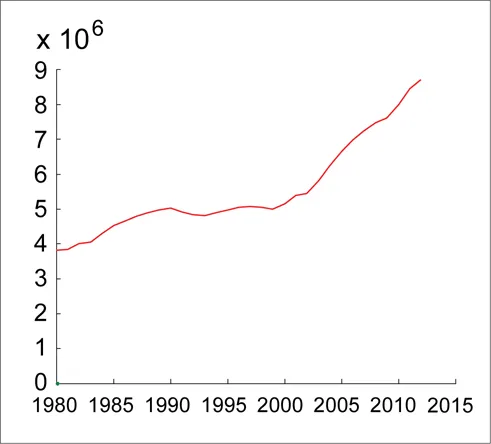
Figure 1.2: Growth in Coal Consumption
The recent use of coal worldwide in short tons is shown in Figure 1.2. The United States Energy Information Administration is the source of this information, and it can be found at www.indexmundi.com/energy.aspx?product=coal&graph=production.
The top ten coal producers in the world in 2011 are listed below [www.mapsofworld.com/world-top-ten/world-map-countries-by-coal-production]:
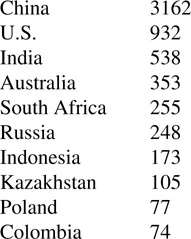
China is by far the world’s largest producer and consumer of coal, accounting for 46% of global coal production and 49% of global coal consumption — almost as much as the rest of the world combined . . . China has accounted for 69% of the 3.2 billion ton increase in global coal production over the last 10 years [www.eia.gov/todayinenergy/detail.cfm?id=16271. The coal consumption in billions of tons in China versus the rest of the world is shown in Figure 1.3. The source for this data is the U.S. Energy Information Administration, International Energy Statistics.
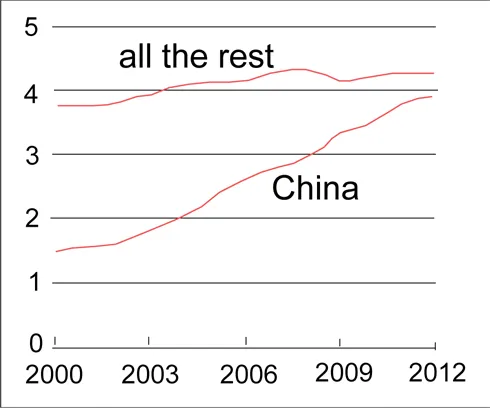
Figure 1.3: Coal Usage in China
The earliest use of oil, as far as we know, was from oil seepages in the Middle East about 3000 BC; the oil was used for ship caulking and road construction, but apparently was not used as fuel. The Chinese discovered natural gas around 200 BC when they drilled a well for brine and hit gas instead. They then figured out that the gas could burn, so they used it to dry the brine into salt.
Similarly, in 1819, a well being drilled for brine in Kentucky struck black petroleum; without a use for this “black stuff,” the well was abandoned. In 1829 another well produced a massive flow of oil; the only use to be found was as a liniment. Finally, in 1859 a well in Pennsylvania was bored for the purpose of extracting oil.
The use of petroleum was virtually unknown in the nineteenth century. Before that the principal fuel, particularly in the United States, was wood. The population density was in the northeast, which was heavily forested. The climax trees were not only massive but were slow growth, high density, and high strength. Their timbers were perfect for ship building — the U.S.S. Constitution which played an important role in the Revolutionary War, was termed “Old Ironsides,” since enemy cannon balls bounced off her sides; she is the oldest warship still under commission in the United States.
1.2 Composition of Fossil Fuels
Whereas coal is formed from plants, petroleum is formed from marine life. In particular, the basis of petroleum is phytoplankton, algae, and bacteria. The petroleum, oil, or gas, found under “trap rock,” usually shale, was formed in the Cenozoic Period about 50 million years ago.
Coal is low in hydrogen (H) and high in carbon (C). C + O2 → heat + CO2. Coal combustion adds almost twice as much CO2 to the atmosphere per unit of energy produced as does natural gas. Crude oil falls between these two [Energy Information Administration, “Emissions of Greenhouse Gases in the United States 1985-1990,” DOE/EIA-0573, Washington, DC, September 1993].
The percentage composition of coal is
carbon 75
ash 10
oxygen 8
hydrogen 5
nitrogen 1.5
sulphur 0.5
ash 10
oxygen 8
hydrogen 5
nitrogen 1.5
sulphur 0.5
The percentage composition of crude oil, the liquid extracted from the ground, is
carbon 83–87
hydrogen 10–14
nitrogen 0.1–2
oxygen 0.1–1.5
sulfur 0.5–0.6
metals <0.1
hydrogen 10–14
nitrogen 0.1–2
oxygen 0.1–1.5
sulfur 0.5–0.6
metals <0.1
Natural gas is mostly methane (CH4). A typical analysis of natural gas, by mole, is
methane 95.2%
ethane 2.5%
propane 0.2%
butanes/pentanes/hexanes 0.09%
nitrogen/carbon dioxide 2%
ethane 2.5%
propane 0.2%
butanes/pentanes/hexanes 0.09%
nitrogen/carbon dioxide 2%
Estimated coal reserves in million short tons per state in 2009 was
Montana 74,770
Wyoming 38,743
Illinois 37,913
West Virginia 17,390
Kentucky 14,480
U.S. TOTAL 260,553
Wyoming 38,743
Illinois 37,913
West Virginia 17,390
Kentucky 14,480
U.S. TOTAL 260,553
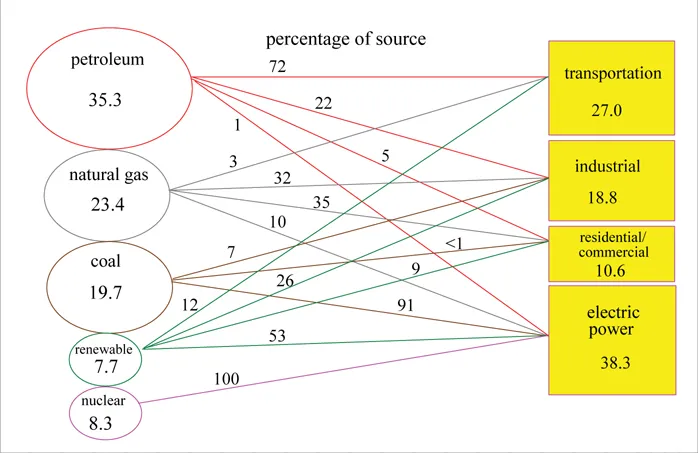
Figure 1.4: From Energy Source to Energy Use
1.3 Fossil Fuels, Uses and Reserves
The source of energy and its uses in today’s world is shown in Figure 1.4. The largest energy source is petroleum. Petroleum imports from 1950 to 2010 increased from almost zero in 1950 to about 50% by 2005 [U.S. Energy Information Administration, Monthly Energy Review, Table 3.1, April 2013]. It is now declining as shown in Figure 1.5 [C.E. Behrens & C. Glover, “U.S. Energy: Overview and Key Statistics,” Congressional research Service, April 2012].
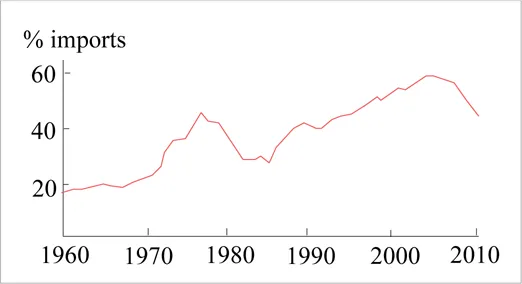
Figure 1.5: Petroleum Imports to the United States.
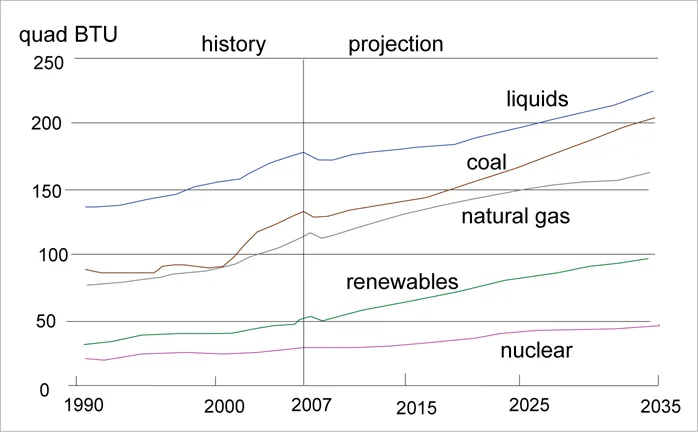
Figure 1.6: Worldwide Energy, Produced and Projected
Per capita energy use in North America, at the equivalent of approximately 91 MWh annually, is higher than in any other part of the world. Europe is next at about 42 MWh. Asia is at 10 MWh, and South America at 12 MWh. The worldwide average is about 19 MWh annually [timeforchange.org].
The energy in quads produced in recent years, and a projection out to 2035, is shown in Figure 1.6. Petroleum, crude oil, is the dominant source. About 50% of petroleum is used as gasoline or diesel oil, about 27% for heating oils, both domestic (diesel oil) and heavy bunker oils. Of the remaining 23%, 11% is used to generate electricity, 6% goes to industrial lubricants, and the remaining 6% is converted into plastics, synthetic rubbers and fibers, fertilizers, paints, detergents, and other products.
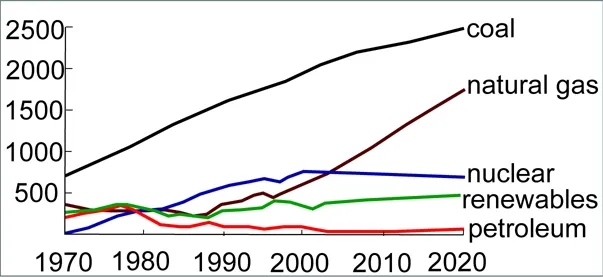
Figure 1.7: Fuel Source for Electrical Generation
Estimated technically recoverable natural gas resources in United States is 2,587 trillion ft3 [Energy Information Administration - Annual Energy Outlook 2010], most of it onshore. This is far higher than the estimate of natural gas resources [National Petroleum Council, “Facing the Hard Truths About Energy,” 2007] of 1,451 trillion ft3. However, a report by Jad Mouawad in the New York Times on June 18, 2009 showed that the estimates of natural gas in shale rocks was 35% higher than previously thought and stood at 2,074 trillion ft3.
We badly underestimated the recoverable reserves of natural gas. In fact, estimates of reserves of natural resources are almost aways far too low. Until recently, estimates of recoverable oil were way off. True, most of the “easy to get out” oil has been fully exploited, but new technologies are finding ways to get at shale oil deep beneath the Earth’s surface, and off-shore drilling platforms are becoming more adventuresome and so, more dangerous: case in point, Deep Water Horizon, discussed briefly in Section IV.
“Excluding the United States, the world holds an estimated 565 billion barrels (bbo) of undiscovered, technically recoverable conventional oil; 5,606 trillion cubic feet (tcf) of undiscovered, technically recoverable conventional natural gas [www.doi.gov/news/pressreleases/USGS-Releases-Global-Estima...
Table of contents
- Cover
- Half Title
- Title Page
- Copyright Page
- Table of Contents
- About the Author
- Preface
- 1 Energy Sources, Energy Uses, and Global Warming
- 2 The Internal Environment of a Residence
- 3 Heat Flow from a Residence
- 4 Residential Construction Techniques
- 5 The Seasons and Solar Angles
- 6 Transmission of Light through the Atmosphere
- 7 Solar Gain and Solar Attenuation
- 8 Transmission of Solar Energy through Glazing
- 9 Climate and the Siting of a Solar Structure
- 10 Solar Structures from Early to Modern
- 11 Passive Solar Collection
- 12 Non-Concentrating, Active Solar Collectors
- 13 Photovoltaic Panels
- 14 Smart Grids, FiTs, and Net Metering
- 15 Architectural Considerations for Capturing Solar Energy
- 16 Methods of Energy Storage
- Index
Frequently asked questions
Yes, you can cancel anytime from the Subscription tab in your account settings on the Perlego website. Your subscription will stay active until the end of your current billing period. Learn how to cancel your subscription
No, books cannot be downloaded as external files, such as PDFs, for use outside of Perlego. However, you can download books within the Perlego app for offline reading on mobile or tablet. Learn how to download books offline
Perlego offers two plans: Essential and Complete
- Essential is ideal for learners and professionals who enjoy exploring a wide range of subjects. Access the Essential Library with 800,000+ trusted titles and best-sellers across business, personal growth, and the humanities. Includes unlimited reading time and Standard Read Aloud voice.
- Complete: Perfect for advanced learners and researchers needing full, unrestricted access. Unlock 1.4M+ books across hundreds of subjects, including academic and specialized titles. The Complete Plan also includes advanced features like Premium Read Aloud and Research Assistant.
We are an online textbook subscription service, where you can get access to an entire online library for less than the price of a single book per month. With over 1 million books across 990+ topics, we’ve got you covered! Learn about our mission
Look out for the read-aloud symbol on your next book to see if you can listen to it. The read-aloud tool reads text aloud for you, highlighting the text as it is being read. You can pause it, speed it up and slow it down. Learn more about Read Aloud
Yes! You can use the Perlego app on both iOS and Android devices to read anytime, anywhere — even offline. Perfect for commutes or when you’re on the go.
Please note we cannot support devices running on iOS 13 and Android 7 or earlier. Learn more about using the app
Please note we cannot support devices running on iOS 13 and Android 7 or earlier. Learn more about using the app
Yes, you can access Building-Integrated Solar Energy Systems by Robert E. Parkin in PDF and/or ePUB format, as well as other popular books in Technology & Engineering & Electrical Engineering & Telecommunications. We have over one million books available in our catalogue for you to explore.