Introduction
Over the past several decades, concerns in various fields with conceptual and methodological issues in conducting research with hierarchical (or nested) data have led to the development of multilevel modeling techniques. Research on organizations such as universities or product and service firms presents opportunities to study phenomena in hierarchical settings. Individuals (Level 1) may work within specific formally defined departments (Level 2), which may be found within larger organizations (Level 3), which, in turn, may be located within specific states, regions, or nations. These individuals interact with their social contexts in a variety of ways. Individuals bring certain skills and attitudes to the workplace; they are clustered in departments or work units having certain characteristics, and they are also clustered within organizations having particular characteristics. Because of the presence of these successive groupings in hierarchical data, individuals within particular organizations may share certain properties including socialization patterns, traditions, attitudes, and work goals. Similarly, properties of groups (e.g., leadership patterns, improvement in productivity) may also be influenced by the people in them. Hierarchical data also result from the specific research design and the nature of the data collected. In survey research, for example, individuals are often selected to participate in a study from some type of stratified random sampling design (e.g., individuals may be chosen from certain neighborhoods in particular cities and geographical areas). Longitudinal data collection also presents another research situation where a series of measurements is nested within the individuals who participate in the study.
In the past, researchers often had considerable difficulty analyzing data where individuals were nested within a series of hierarchical groupings. Ignoring such data structures can lead to false inferences about the relations among variables in a model, as well as missed insights about the social processes being studied. Today, however, for studying individual and group phenomena, multilevel modeling is an attractive approach because it allows the incorporation of substantive theory about such individual and group processes into the clustered sampling schemes typical of large-scale survey research. It is steadily becoming the standard analytic approach for research in fields such as business, education, health sciences, and sociology because of its applicability to a broad range of research situations, designs, and data structures (e.g., hierarchical data, cross-classified data, longitudinal data). Multilevel modeling is referred to by a variety of names including random coefficients models, mixed-effects models, multilevel regression models, hierarchical linear models, and multilevel structural equation models. This diversity of names is an artifact of the statistical theory underlying multilevel models—theory developed out of methodological work in several different fields. For this reason, there are some differences in the preferences and manner in which the methods are presented and used within various fields. At their core, however, these methods are all integrally related by virtue of their primary emphasis on the decomposition of variance in a single outcome or a multivariate set of outcomes and the explanation of this variance by sets of explanatory variables that are located in different strata of the data hierarchy.
We begin with the principle that quantitative analysis really deals with the translation (or operationalization) of abstract theories into concrete models and that theoretical frameworks are essential guides to sound empirical investigation. Statistical models are not empirical statements or descriptions of actual worlds (Heckman, 2005); rather, they are mathematical representations of behaviors and attitudes believed to exist in a larger population of interest. In other words, our statistical models represent a set of proposed theoretical relations thought to exist in the population—a set of theoretical relationships that account for relationships actually observed in the sample data from that population (Singer & Willett, 2003).
Providing a Conceptual Overview
Multilevel conceptual frameworks open up new possibilities for investigating theories concerning how individuals and groups interact. We refer to the lowest level of the hierarchy (Level 1) as the micro level, with all higher levels in the hierarchical data structure as the macro level. As an example, we might be interested in defining and examining relationships between individual, departmental, and organizational processes on organizational productivity. A three-level conceptual model might include variables relating to individuals at the micro level (Level 1), departments at Level 2, and organizations at Level 3. We could, of course, define higher organizational levels such as locales, regions, or nations at Level 4 through k. From this perspective, the relationships among variables observed for the micro-level units (individuals) in a study have parameters that can take on values different from those of the higher-level units (e.g., departments or organizations). Macro-level variables are frequently referred to as groups or contexts (Kreft & de Leeuw, 1998). With a contextual model, therefore, one could envision successive levels extending well beyond the organization.
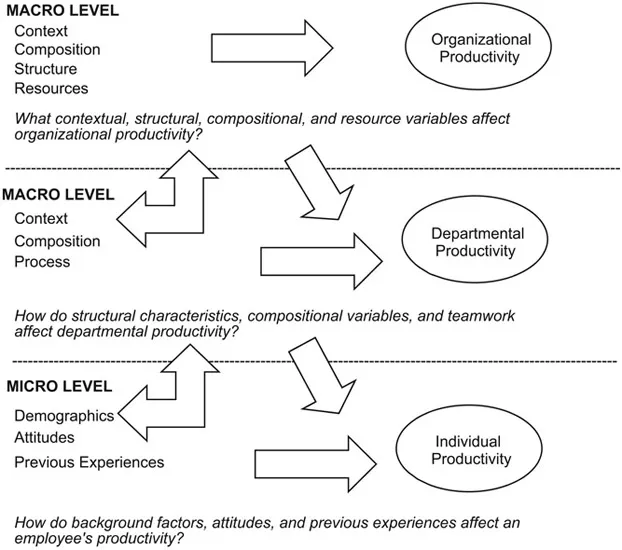
Each of these groupings or levels of context may exert effects on, for example, productivity in the workplace. Outcomes may be influenced by combinations of variables related to the backgrounds and attitudes of employees (e.g., experience, education and work-related skills, attitudes and motivations), the processes of organizational work (e.g., leadership, decision making, staff development, organizational values, resource allocation), the context of the organization, or the cross-level interactions of these variables within the structure of the organization (e.g., size, management arrangements within its clustered groupings). Some of these possible theoretical relationships within and between levels are summarized in Figure 1.1.
Research strategies for dealing with the complexity of the multilevel, or contextual, features of organizations have been somewhat limited historically. Researchers did not always consider the implications of the assumptions they made about measuring variables at their natural level, or moving them from one level to another through aggregation or disaggregation. This process is summarized in Figure 1.1 with two-headed arrows. Aggregation, for example, means that the productivity level of individuals within departments or organizations would be combined to a higher level (e.g., the organizational level). Successive aggregation of variables reduces the variability in productivity within each individual and within each unit to a single organizational-level variable. The comparison is then made between organizations’ mean productivity outcomes. Of course, failing to acknowledge the within-group variability present in the data can potentially distort relationships examined between such units leading to what Robinson (1950) called an ecological fallacy.
In contrast, disaggregation refers to moving a variable conceptualized at a higher level to a lower level. For example, in a different analysis we may have productivity measured at the organizational level but also have items that express individual employee attitudes and motivation. In this case, we intend to analyze the data at the individual level to see whether employee attitudes influence productivity. If we assign to all individuals the same value on the organizational productivity variable (and possibly other organizational variables such as size), we attribute properties of the organization to individuals. This can also confound the analysis.
FIGURE 1.1 Defining variables and relationships in a multilevel conceptual model.
Examples such as these suggest that analyses conducted exclusively at the micro or macro level may produce different results. Treating individuals as if they were independent of these various organizational groupings ignores the complexity inherent in the data and introduces a potentially important source of bias into the analysis. This is because individuals in a group or context tend to be more similar on many important variables (e.g., attitudes, behaviors) than individuals in different contexts. With hierarchical data, a more complex error structure must be added to account for the dependencies among observations. Such dependencies violate key assumptions of single-level analyses such as ordinary least squares (OLS) regression and can lead to underestimated variances and standard errors. This in turn may result in drawing erroneous conclusions about the empirical relationships under consideration (Thomas & Heck, 2001).
As one may surmise, it is important to develop a scheme to place the explanatory variables hypothesized to affect individuals and other types of organizational processes in their proper hierarchical locations. This helps to clarify the organizational, or contextual, level to which they rightly belong. Different sets of variables associated with each level, or cluster, in the data quite likely affect productivity in the workplace. These relationships are indicated by horizontal arrows in Figure 1.1. As the figure indicates, each level within the data hierarchy can suggest different sorts of questions to be asked. For example, at the micro level, we might be interested in how specific individual variables affect employees’ productivity. At the organizational level, we might be interested in how the availability of resources explains differences in productivity levels between organizations.
In addition, there are also likely effects that may result from various interactions across organizational levels. These cross-level relationships are shown in Figure 1.1 with arrows that extend from the macro level toward the micro level. More specifically, we might ask how departmental teamwork moderates (i.e., enhances or diminishes) the relationship between employee attitudes and productivity within organizations. In the past, mapping these sorts of relations between groups and individuals has often been problematic—often focusing on single, discrete elements while ignoring the interrelated aspects of larger organizational processes. In specifying this type of cross-level relationship, we can assess how the presence of a feature such as democratic decision making at the department level may coordinate the behavior of individuals within those work units.
One important contribution of multilevel modeling, then, is to allow the researcher to avoid the aggregation (i.e., assigning the same organizational mean to each member) or disaggregation (i.e., treating subjects as independent from their organizational groupings) problem. Developing a conceptual framework of organizational relations can also help the researcher avoid another potential source of bias within the analysis—that of ignoring the different levels of the explanatory (independent) variables. Figure 1.1 also suggests that through examining the variation in outcomes that exists at different levels of the data hierarchy, we can develop more refined theories about how explanatory variables at each level contribute to variation in the outcomes examined in the study. Importantly, where single-level analyses focus on average effects, which are each typically fixed at one value for the whole study sample, multilevel modeling procedures open up possibilities for examining how outcome intercepts (means) such as productivity and regression coefficients (slopes) regarding relationships at lower levels of the data hierarchy may vary across higher-order units in the sample.
Analysis of Multilevel Data Structures
As Figure 1.1 implies, decisions about analysis are located within a larger conceptual and methodological framework that begins with research questions and designs, data structures, and methods of analysis (Raudenbush, 1988). For organizational theories in particular, variables must be defined and measured at multiple levels of interest within a data hierarchy. These decisions about a study’s conceptualization and conduct are critical to the credibility of the analyst’s results and to the study’s overall contribution to the relevant knowledge base.
The goal of multilevel analyses may be either prediction or explanation. In the former instance, the focus is more on efficiency of prediction and parsimony of variables included in the prediction equation, while in the latter case, the focus rests more upon the correct specification of a theoretical model under consideration. Our approach toward multilevel modeling takes us generally in the direction of explanation; that is, the researcher formulates a model from theory to explain variability in the outcomes and then tests this model against the data. We call attention to this distinction between explanatory and predictive aims, however, because in predictive studies, variables would be retained in an analysis only if they were statistic...