![]()
1
Introduction
THE EXAMPLE STUDY USED THROUGHOUT THE BOOK
THE BOOK OUTLINE
Chapter aim: To introduce SPSS, our example survey and an outline of the book
SPSS is an excellent software package for statistical analysis, that can be easily used to produce simple statistical summarises of data (such as totals and means) or, for those who wish to, undertake complex statistical modelling. Its windows interface means that it is quite intuitive to use regardless of what you want to do. SPSS is commonly available at universities where the licence allows both staff and students to have a personal copy of the software to use with their academic research data. SPSS is particularly popular in the social sciences, but is used by staff and students in a variety of departments in universities, for research in marketing, health, education and the media (to name but a few) and outside universities for data analysis by a wide range of different organisations. The accessibility and ease of use of SPSS means that it can do a lot more than complex statistics. Numerical data can be beautifully presented visually in graphs and tables. With SPSS, you can create graphs and tables at a click of the button and effectively present numerical information, which can easily be transferred to word-processing software for a written report or presentation software for an oral presentation.
You may be about to start a research project at university, examining feedback from a group of people, undertaking some form of product evaluation or wanting to make sense of some published data from an organisation such as a government office. Whatever you are doing, you will have an overall aim for your study that is examined through a research question or hypothesis. Using SPSS, you will be able to summarise the research data in the form of tables and graphs so that you can make sense of the numbers that you have collected, and the reader of your report will gain an insight into what the numbers mean in relation to your aim, question or hypothesis.
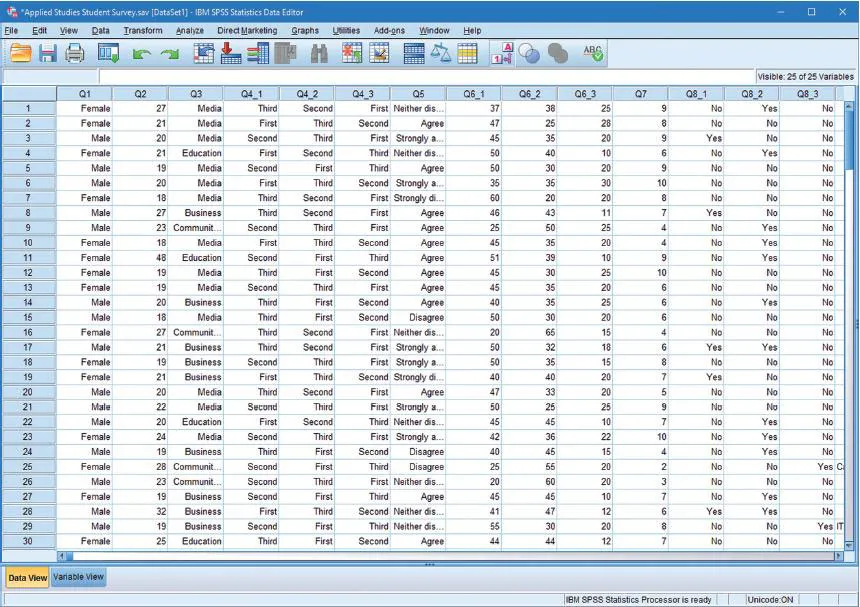
SPSS is an easy-to-use program, employing familiar features, such as windows, toolbars and menus. The data you wish to analyse is entered into a spreadsheet similar in format to other spreadsheet programs such as Microsoft Excel. However, it allows you to label your data, giving you the option to display either the actual numbers or the labels in the window. Rather than viewing only lists of numbers in your spreadsheet, where appropriate you can see the data in terms of meaningful words. For example, in the example data below we can see, in the first column, the gender of each of the participants who took part in the survey, with each row showing the responses of a different participant to the survey questions.
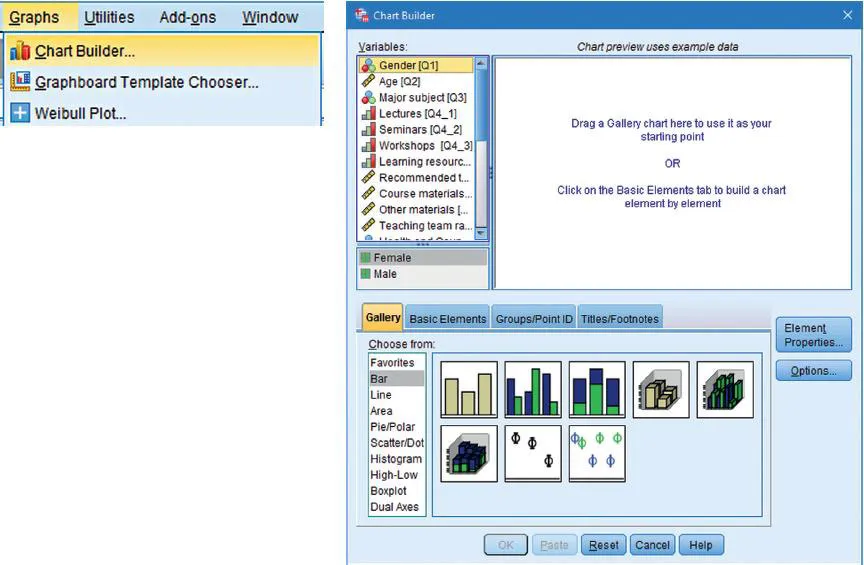
SPSS is made up of drop-down menus, commands and options that enable you to generate tables and graphs (as well as undertaking different statistical analyses). We will go through these step by step and explain the different outputs that can be produced. For example, in the following screenshots, we see that there is a dropdown menu called Graphs and the first option is a command called Chart Builder. When explaining an SPSS procedure we will highlight the SPSS instructions in bold.
When this is clicked, a Chart Builder window appears and by selecting a chart or graph, and dragging and dropping the data into place, you can easily produce the chart that you want. Even after you have created the chart, you can still change any of the features of it through the simple editing process, before saving it to use in your report.
THE EXAMPLE STUDY USED THROUGHOUT THE BOOK
We believe that when learning anything new it is helpful to follow an example that you can relate to your own work. There are number of different examples of small-scale research that are used to describe the different features of SPSS throughout the book, drawing on the different types of research that you might yourself undertake. We follow a step-by-step process of demonstrating each feature of SPSS using our examples but these procedures can be followed using your own data. We shall also describe one example in detail throughout the book, which we have called the Sparcote Study, that we will employ to illustrate the different research concepts, numerical and statistical terms. Also, this will involve describing a survey in detail, explaining how it is constructed, carried out and how the data is input into SPSS and analysed to produce professional-looking tables and graphs to summarise the research findings.
The Sparcote Study
The example we have chosen is of a small-scale piece of descriptive research undertaken in a (fictional) university. Sparcote University is a small campus university on the edge of the city of Sparcote. One year ago the university took in its first cohort of students in the new Department of Applied Studies. At the end of the first year the department wants to review the success of the programme. As part of the review, two of the staff members are undertaking a small research study with the aim of finding out about the students’ experiences during their first year in the new Department of Applied Studies. This is the Sparcote Study that we will be referring to throughout the book.
THE BOOK OUTLINE
The chapters are set out so that the reader can work through the book either prior to collecting data or after their data collection has been completed. The chapters will take you through the different types of data that you have collected and explain how to summarise and present them using SPSS. We describe the types of table and graph you can use with different sorts of data and the different SPSS commands you can use to produce them. The book is designed so that you can dip into any chapter to find the procedure you are interested in, as well as following through the chapters to see how we have analysed the data in our examples.
Chapter 2
Chapter 2 introduces you to the process of doing a research study starting with the very important issue of deciding what your research is all about. When considering your research aim(s) and your specific question(s) you will need to think about the purpose of your research: to explore ‘new territory’, describe a particular situation or test a prediction. When you know what you want to research, and why, the next thing to think about is how to carry it out. While there are a number of different research methods (such as interviews, experiments or surveys), this book focuses on analysing the results of those methods where the research data is collected in the form of numbers rather than spoken or written text. Research questions such as how many? how much? how long? all produce numeric data in the results. If the research involves people (asking people to participate in the study to generate the results) then this requires a consideration of who and how many people to ask (called ‘sampling’) and how to treat them (referred to as ‘research ethics’). Once data has been collected, you need to describe and summarise it for communicating to others, usually in the form of a written report. It is at this stage of the research process that SPSS can be extremely helpful, as we explain throughout the book. This chapter also provides an overview of the basic terms used in summarising your data.
Chapter 3
This chapter explains that not all numbers collected in research are the same. Sometimes we collect numbers as names, such as the number on the shirts of the members of a sports team. The numbers do not have any other meaning – we don’t expect the player with a 4 on his shirt to be twice as good as the player with a number 2! At other times we use numbers to put things in order, such as listing a person’s preference for three different drinks into first, second and third. Finally, we use numbers as precise scores, such as the time it takes a person to run 100 metres or a measure of how tall they are. We explain about these different types of number, called ‘outcome measures’, so that you can decide what types of data you are collecting in your own research. This is important for preparing your results for analysis, such as entering them into SPSS. We also explain about ‘coding’, that is, providing a label to explain what a particular number refers to when numbers are used as names, such as the label ‘goalkeeper’ for the shirt number 1 in a sports team. Particularly with surveys, coding is a very important stage in preparing the data for analysis. In this chapter, we use the example of our Sparcote Study – where a survey has been produced – to explain how to code a range of different types of question. Once the data has been coded, it can be input into SPSS in the form of a spreadsheet (just like Excel) for analysis, as explained in the next chapter.
Chapter 4
Chapter 4 introduces you to SPSS. We explain each of the windows that open up when you run SPSS. SPSS stores the data in the form of a spreadsheet, with the results stored in columns called ‘variables’, with each row referring to the data from a single participant. Before you can enter your data into SPSS, you can tell it what each of the different ‘variables’ refers to so that you can give labels to the numbers you are inputting. We explain step by step, using the example from the Sparcote Study, how to set up SPSS and enter the data for your study, so that it is ready for analysis. However, many research projects collect their data electronically (such as when using software to run an experiment) or online (such as when using an online survey program), so the chapter also details how to import your research data from other applications into SPSS. We then explain how you can check that the data has been properly imported. We give examples of how you can edit the labels and correct any problems with importing the data from another program. Finally, the data will be stored in SPSS, ready for analysis.
Chapter 5
This chapter describes how simple it is in SPSS to produce a set of summary results of your data in the form of a table or a graph using a single command, Frequencies. For a researcher, the first thing they usually wish to do is to display a set of the basic findings from their research, such as how many people answered each particular response in a survey. Using a number of different examples, including a summary of the different responses in the Sparcote Study, this chapter shows how easy it is to produce summary statistics for different types of data just by using the SPSS Frequencies command. The procedure for using the Frequencies command is described clearly with screenshots illustrating each step of the straightforward process. Using this one command, a chart of the data can be produced alongside a summary table simply by clicking a button or selecting the appropriate box. For many researchers, this may be all that is required to describe the key results of their study. However, in later chapters, we explain how more sophisticated tables and graphs can be produced and how these basic tables and graphs can be edited to exactly what is required.
Chapter 6
This chapter explains how to produce a range of different tables in SPSS. Researchers often want to combine two variables (such as ‘gender’ and ‘favourite colour’) in one table rather than displaying each variable as a separate table. While the Frequencies command can display a table for ‘gender’ (showing how many men and women took part in the study) and for ‘favourite colour’ (showing how many participants preferred each of the colour choices), combining the two in a table – called a crosstabulation – allows the colour choices of the men and women to be displayed side by side, allowing their choices to be compared. We show how to perform crosstabulations in SPSS using the Crosstabs command. This chapter shows the researcher how to recode their data (such as ‘age’) into groups (such as ‘age groups’) so that it is suitable for a crosstabulation. The chapter also discusses how to produce tables with percentages as well as, or instead of, counts. The final section focuses on the Custom Tables command. Custom Tables is a flexible and complex table producing feature in SPSS. However, it has an intuitive and user-friendly interface, so that, once the basics of its instructions are mastered, then some very professional tables can be produced, allowing the researcher to present their data in exactly the form that is required.
Chapter 7
SPSS has an excellent graph drawing feature called Chart Builder. While generally it is quite intuitive in operation, there are one or two instructions that appear to be hidden or secret (for example, to produce a specific type of graph you have to click on a small cross on the screen). This chapter will explain how to use Chart Builder. This command allows the researcher to create a basic graph using a drag-and-drop method similar to using the Chart Wizard in Microsoft Excel. Examples of producing the most popular charts used in research (pie chart, bar chart, line graph and scatterplot) will be given, so that the reader can follow the example for the particular graph she wishes to produce. Once the basics of Chart Builder have been mastered, the user can then produce a wide range of charts and graphs to best illustrate their data. The Chart Builder command also includes options of how to add titles and change exactly what is displayed (such as totals, percentages or means). Finally, SPSS has an excellent feature that allows a graph to be drawn from the data in a table that has already been produced, called Create Graph. Even if a chart was not selected when the table was created, it is possible to simply click on the table in the output file and, using Create Graph, produce the appropriate graph such as a pie chart, bar chart or line graph. This is explained step by step in this chapter, using a number of different examples.
Chapter 8
This chapter explains how SPSS tables and graphs can be edited, providing a range of different examples of the sort of editing that you can undertake. Some other data analysis programs do allow you to create tables and graphs but, once produced, they cannot be changed. Everything that SPSS produces, such as tables and graphs, are all stored an output file. This file can be saved at any time and the output viewed again whenever it is needed. However, an excellent feature of the output file is that it can be edited at any time to change a table, produce a chart or reorganise a graph. The editing tools Pivot Table, Chart Editor and Create Graph (explained in the previous chapter) are extremely flexible with numerous features. We explain a number of the key options in this chapter. New headings can be added to tables and graphs and labels can be changed to exactly what is wanted for a research report. The size and format of the axes on a graph can be changed. Users can look at their output file at any time when using SPSS. SPSS allows the whole of the output file to be saved, but it also allows different parts of it to be saved separately, such as a sin...