Applied Statistical Inference with MINITAB®, Second Edition
eBook - ePub

Applied Statistical Inference with MINITAB®, Second Edition

  1. 478 pages
  2. English
  3. ePUB (mobile friendly)
  4. Available on iOS & Android
eBook - ePub

Applied Statistical Inference with MINITAB®, Second Edition

Book details
Book preview
Table of contents
Citations

About This Book

Praise for the first edition:

"One of my biggest complaints when I teach introductory statistics classes is that it takes me most of the semester to get to the good stuff—inferential statistics. The author manages to do this very quickly….if one were looking for a book that efficiently covers basic statistical methodology and also introduces statistical software [this text] fits the bill." - The American Statistician

Applied Statistical Inference with MINITAB, Second Edition

distinguishes itself from other introductory statistics textbooks by focusing on the applications of statistics without compromising mathematical rigor. It presents the material in a seamless step-by-step approach so that readers are first introduced to a topic, given the details of the underlying mathematical foundations along with a detailed description of how to interpret the findings, and are shown how to use the statistical software program Minitab to perform the same analysis.


  • Gives readers a solid foundation in how to apply many different statistical methods.


  • MINITAB is fully integrated throughout the text.


  • Includes fully worked out examples so students can easily follow the calculations.


  • Presents many new topics such as one- and two-sample variances, one- and two-sample Poisson rates, and more nonparametric statistics.


  • Features mostly new exercises as well as the addition of Best Practices sections that describe some common pitfalls and provide some practical advice on statistical inference.

This book is written to be user-friendly for students and practitioners who are not experts in statistics, but who want to gain a solid understanding of basic statistical inference. This book is oriented towards the practical use of statistics. The examples, discussions, and exercises are based on data and scenarios that are common to students in their everyday lives.

Frequently asked questions

Simply head over to the account section in settings and click on “Cancel Subscription” - it’s as simple as that. After you cancel, your membership will stay active for the remainder of the time you’ve paid for. Learn more here.
At the moment all of our mobile-responsive ePub books are available to download via the app. Most of our PDFs are also available to download and we're working on making the final remaining ones downloadable now. Learn more here.
Both plans give you full access to the library and all of Perlego’s features. The only differences are the price and subscription period: With the annual plan you’ll save around 30% compared to 12 months on the monthly plan.
We are an online textbook subscription service, where you can get access to an entire online library for less than the price of a single book per month. With over 1 million books across 1000+ topics, we’ve got you covered! Learn more here.
Look out for the read-aloud symbol on your next book to see if you can listen to it. The read-aloud tool reads text aloud for you, highlighting the text as it is being read. You can pause it, speed it up and slow it down. Learn more here.
Yes, you can access Applied Statistical Inference with MINITAB®, Second Edition by Sally A. Lesik in PDF and/or ePUB format, as well as other popular books in Matematica & Probabilità e statistica. We have over one million books available in our catalogue for you to explore.

Information

Year
2018
ISBN
9780429816642

1

Introduction

1.1 What is Statistics?

Statistics is a branch of mathematics that deals with collecting, analyzing, presenting, and interpreting data. Many different fields use statistics as a way to understand complex relationships by collecting and analyzing data and presenting the results in a meaningful way. For instance, a researcher in education may want to know if using computers in an algebra classroom can be effective in helping students build their mathematical skills. To answer this question, the researcher could collect data about computer usage and mathematical skills and try to extract information in a meaningful way. A marketing manager for a luxury car manufacturer may want to know whether or not customers are satisfied with their luxury car purchase. The manager may collect data for a sample of their customers and then use this data to make a generalization to the larger group of all their luxury car buyers. In other fields, such as environmental science, researchers may want to figure out the factors that may contribute to global warming by collecting data about the makes and models of automobiles emitting larger amounts of greenhouse gas.
Since statistics deals with collecting, analyzing, presenting, and interpreting data, we first need to develop an idea about what data is. Generally speaking, data is information, characteristics, or attributes about some observation of interest or a set of observations of interest. A set of data represents a collection of variables that represent information about characteristics or attributes for a number of different observations. Data sets usually consist of a collection of observations and each observation can have measures of a variable or variables of interest. For instance, Table 1.1 gives an example of a small data set that describes the number of credits attempted, the number of hours worked each week, major, and gender for a random sample of five university freshmen. The rows of the data set represent each observation consisting of an individual student. The columns of the data set represent the different variables, and each student has measures for each of the four different variables that represent the number of credits, number of hours worked each week, major, and gender.
There are two basic types of data that can be collected, quantitative data and qualitative data. Quantitative data is data that is numeric in form. The main purpose of collecting quantitative data is to describe some characteristic or attribute using numbers. For example, quantitative data that represent the number of credits taken by students in a semester or the number of hours that students work each week can be collected. On the other hand, qualitative data is data that is categorical in nature and describes some characteristic or attribute with words or descriptions. For instance, qualitative data can be used to describe a student’s major or their gender.
TABLE 1.1
Data Set Showing Different Characteristics for Five University Freshmen
Observation Number
Number of Credits
Number of Hours Worked Each Week
Major
Gender
1
15
22
Business
Male
2
12
20
Engineering
Male
3
9
0
Education
Female
4
18
18
Business
Female
5
15
9
Science
Male
The data set in Table 1.1 contains both quantitative and qualitative variables. The number of credits and the number of hours worked each week are examples of quantitative data since these variables are numeric in form, whereas major and gender are examples of qualitative data since these variables describe different categories or characteristics.
Determining whether to collect quantitative or qualitative data is driven by the characteristic or relationship that is being studied and the type of data that is available.

1.2 What This Book Is About

The purpose of this book is to introduce some of the many different statistical methods and techniques that can be used to analyze data along with effective ways to present the information extracted from data in a meaningful way. There are three broad areas of statistics that will be covered in this book: summary tables and graphical displays, descriptive representations of data, and inferential statistics.

1.3 Summary Tables and Graphical Displays

Graphical displays of data visually present some of the properties or characteristics of data by using different types of charts and graphs. The advantage of using charts and graphs to display data is that large amounts of information can be displayed in a concise manner.
For example, suppose you are interested in comparing the fuel efficiency of four different types of vehicles— Minivans, SUVs, Compact Cars, and Mid-Size Cars. You could obtain the average miles per gallon (MPG) for both city and highway driving for each of the types of vehicles and then create a summary table and/or a graph to illustrate the comparison between the different types of vehicles. A summary table is given in Table 1.2 and a graphical display is illustrated in Figure 1.1.
Note that Figure 1.1 graphically displays the city and highway MPG for each of the four different types of vehicles, and the graph allows you to compare and contrast mileages between the four different types of vehicles.
TABLE 1.2
Tabular Summary of the Average City and Highway MPG for Minivans, SUVs, Compact Cars, and Mid-Size Cars
Average City MPG
Average Highway MPG
Minivans
17.5
24.1
SUVs
17.4
22.4
Compact Cars
26.0
33.5
Mid-Size Cars
22.4
30.2
fig1_1_B.webp
FIGURE 1.1
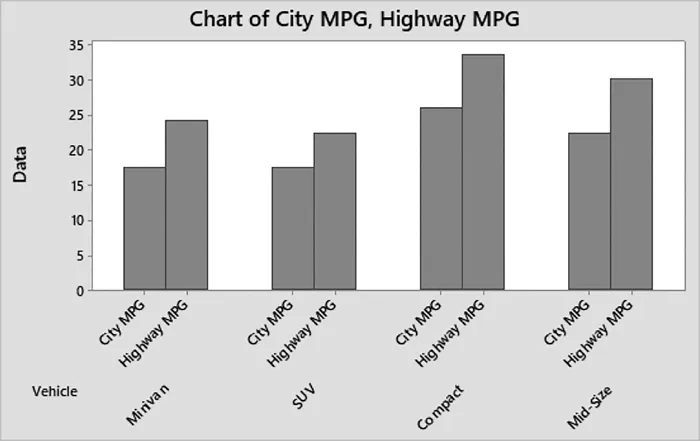
Bar chart comparing the average city MPG and the average highway MPG based on the four different types of vehicles.

1.4 Descriptive Representations of Data

Descriptive representations of data consist of methods and techniques that can be used to describe and summarize data. For instance, if you have ever shopped for a new car, you may have noticed that the sticker on the window of the car provides you with an estimate of the average miles per gallon (MPG) that you can expect for both city and highway driving. This number describes, on average, the gas mileage that you can expect from the vehicle. For example, if the sticker on the window of your new car is 25 MPG in the city and 36 MPG on the highway, then you can expect that your new vehicle will get approximately 25 MPG driving in the city and approximately 36 MPG driving on the highway. This does not necessarily suggest that you are guaranteed to get these mileages because these numbers are averages and they will vary based on your driving style and how you maintain your vehicle, along with a host of other factors. These numbers represent summarized data that you can use to estimate how efficient (or inefficient) the vehicle is. If you want to learn more about the information provided on the window labels of new cars, visit the website of the U.S Department of Energy (https://www.fueleconomy.gov/feg/label/learn-more-gasoline-label.shtm...

Table of contents

  1. Cover
  2. Half Title
  3. Title Page
  4. Copyright Page
  5. Dedication Page
  6. Table of Contents
  7. Preface
  8. Acknowledgments
  9. 1. Introduction
  10. 2. Graphs and Charts
  11. 3. Descriptive Representations of Data and Random Variables
  12. 4. Statistical Inference for One Sample
  13. 5. Statistical Inference for Two-Sample Data
  14. 6. Simple Linear Regression
  15. 7. More on Simple Linear Regression
  16. 8. Multiple Regression Analysis
  17. 9. More on Multiple Regression
  18. 10. Analysis of Variance (ANOVA)
  19. 11. Nonparametric Statistics
  20. 12. Two-Way Analysis of Variance and Basic Time Series
  21. Appendix
  22. Index